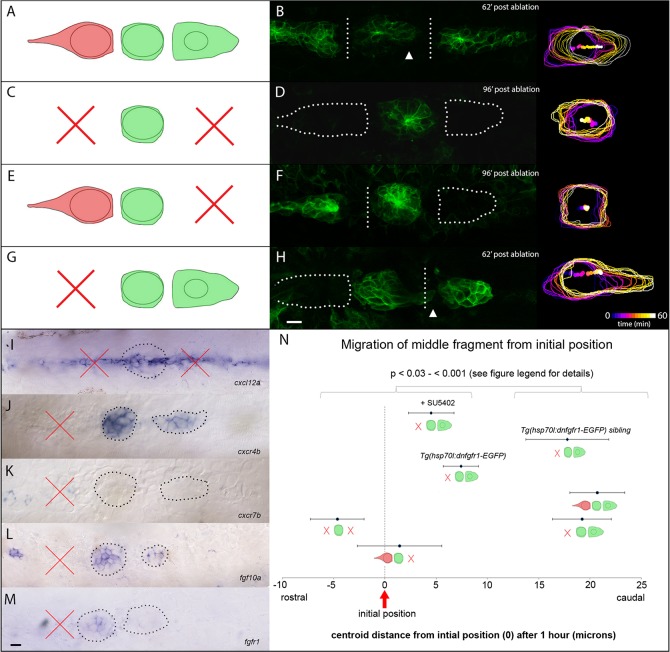
Fig. 4.
PLLp morphology following double laser ablation. (A,B) Schematic of ablation and PLLp fragments 62 min after ablation to separate leading, middle and trailing fragments. Arrowhead indicates migration of middle fragment toward leading fragment. (C,D) Schematic of ablation and PLLp fragments 96 min after ablation to remove leading and trailing cells. (E,F) Schematic of ablation and PLLp fragments 96 min after ablation to separate middle from trailing cells, and remove leading cells. (G,H) Schematic of ablation and PLLp fragments 62 min after ablation to separate middle from leading cells, and remove trailing cells. Arrowhead indicates migration of trailing cells toward leading cells. Right panels in B,D,F,H show outlines and centroid position of middle fragments over time (see scale in H). (I) Expression of cxcl12a in the horizontal myoseptum after ablation. (J,K) Expression of cxcr4b (J) and cxcr7b (K) in PLLp immediately following ablation to generate isolated leading and middle fragments. (L,M) Expression of fgf10a (L) and fgfr1 (M) in PLLp immediately following ablation to generate isolated leading and middle fragments. In I-M, dashed lines indicate PLLp fragments. Crosses indicate ablated fragments. (N) Quantification of middle fragment centroid movement in all experimental conditions, as indicated by diagrams (mean±s.e.m.). Statistical significances of all pairwise comparisons between the indicated groups fall between P<0.03 and P<0.001, Student's t-test. See supplementary material Table S2 for all pairwise statistical comparisons. Scale bars: 10 µm.

