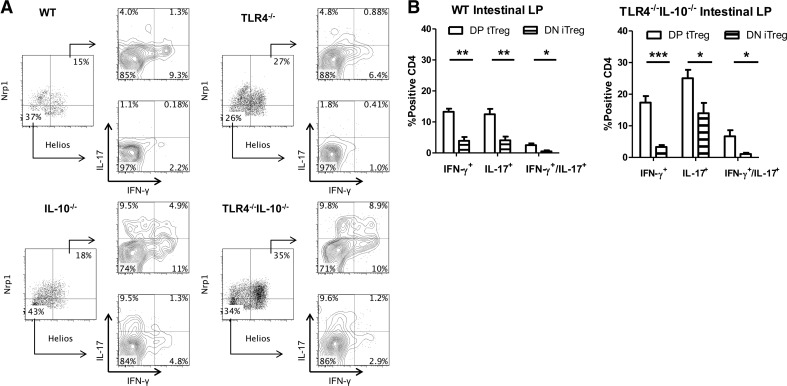
Figure 5. Intestinal Helios+ Nrp1+ Tregs and Helios−Nrp1− Tregs differentially produce IFN-γ and IL-17.
(A) Treg (CD4+Foxp3+) cells were separated into Helios+Nrp1+ and Helios−Nrp1− Tregs and analyzed for IFN-γ and IL-17 expression from the intestines of TLR4−/−, IL-10−/−, TLR4−/−IL-10−/−, and WT mice. (B) Helios+Nrp1+ Tregs (DP tTreg) and Helios−Nrp1− Tregs (DN iTreg) from the intestines of TLR4−/−IL-10−/− and WT mice were analyzed for IFN-γ and IL-17 production. Bar charts are calculated based on total double-positive tTreg or double-negative iTreg and reflect mean ± sem. *P < 0.05, **P < 0.01, and ***P < 0.001. Data are representative of three or more experiments of two or more mice/group. FACS plots are gated upon live CD4+Foxp3+ cells.

