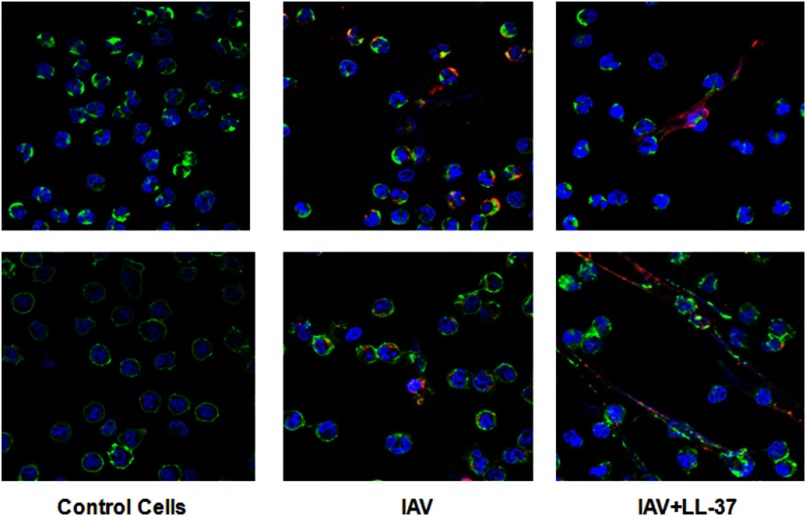
Figure 6. Location of IAV with respect to NETs using confocal microscopy.
Confocal microscopic images from two representative experiments of neutrophils treated with control buffer, IAV, or IAV + LL-37 (32 μg/ml). DNA was stained blue with DAPI, cell membranes green with WGA-Oregon Green, and IAV red with Alexa Fluor 594. NET formation was present in many fields of IAV-exposed cells but was more evident in cells treated with IAV + LL-37. The images shown were taken at 100× original magnification.

