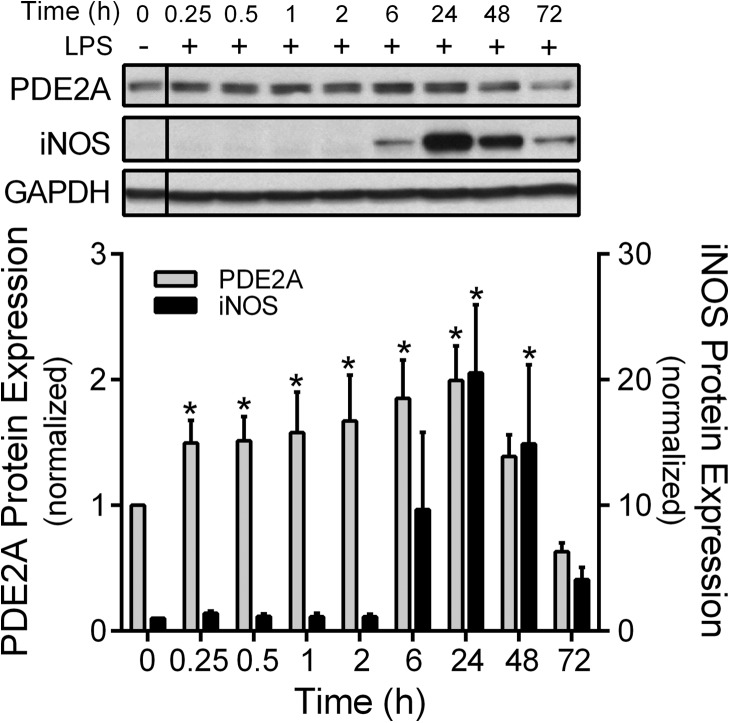
Figure 1. Time course of PDE2A and iNOS protein expression by Western immunoblot in MH-S macrophages following LPS (100 ng/ml).
The PDE2A and iNOS protein levels are normalized to GAPDH loading control and then to control MH-S cells not exposed to LPS (n=3 independent experiments). The vertical line separating the control LPS cells indicates that this lane came from a different part of the same gel. Values are means ± se. *P < 0.05 versus the Time 0 control cells.

