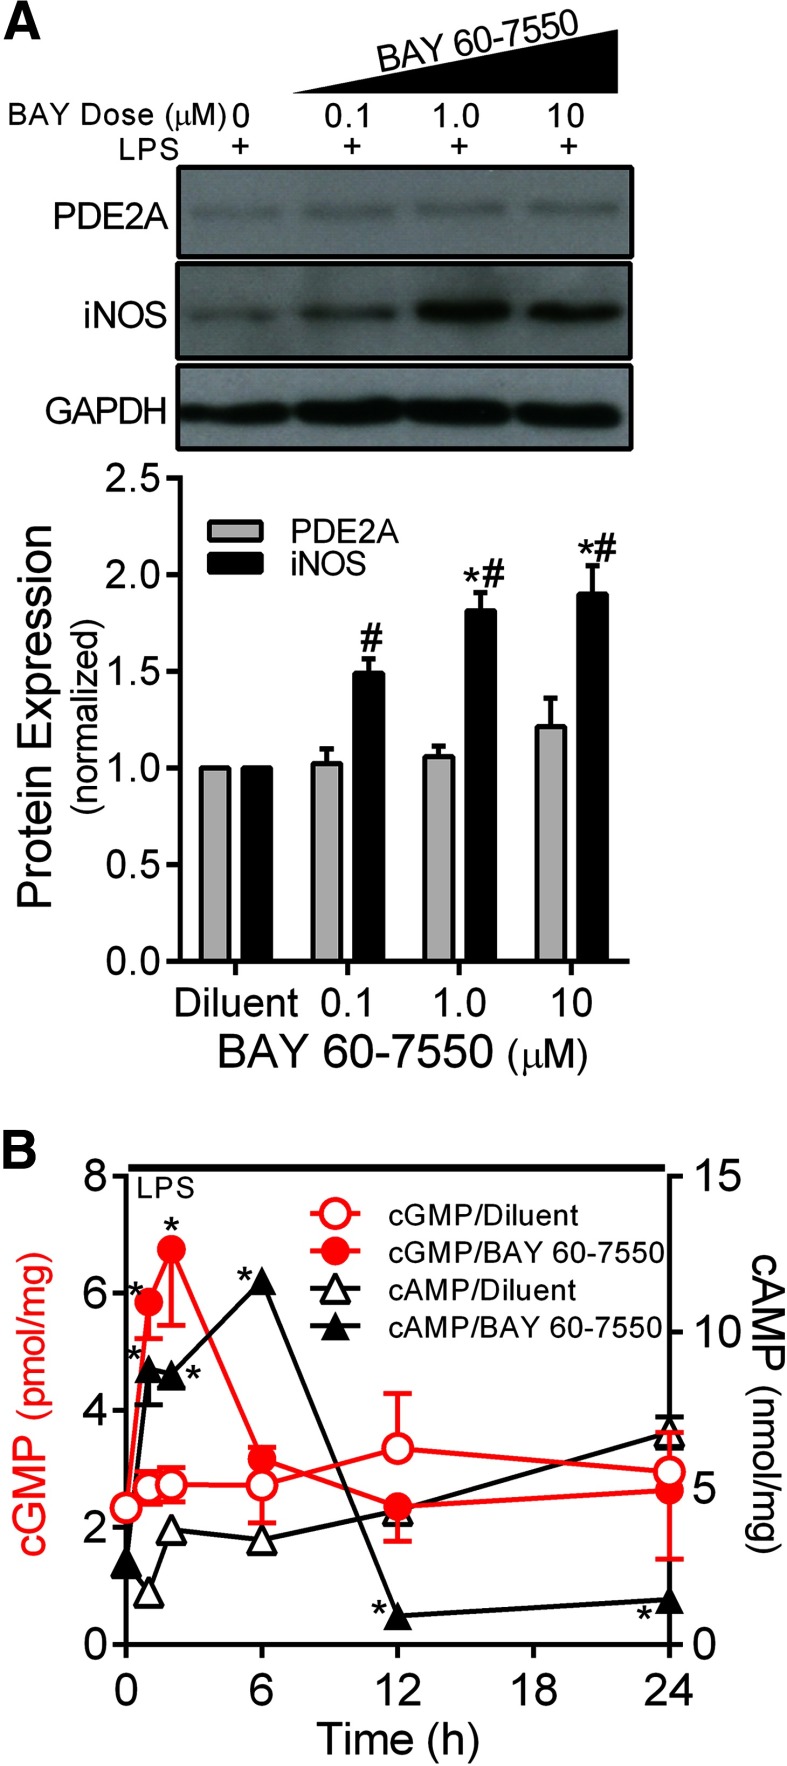
Figure 3. (A) Effect of increasing concentrations of the PDE2A inhibitor BAY 65–7550 on MH-S macrophage PDE2A and iNOS expression by Western blot with densitometric analysis measured after 24 h of exposure to LPS (100 ng/ml).
The PDE2A and iNOS protein levels are normalized to GAPDH loading control and then to control cells that were exposed to LPS with BAY 65–7550 diluent (n=3 independent experiments). Values are means ± se. #P < 0.001 versus diluent; *P < 0.001 versus 0.1 μM BAY 60–7550. (B) Effect of BAY 65–7550 (1 μM) versus the DMSO diluent on the time course of intracellular cGMP (red) and cAMP (black) concentrations in MH-S macrophages exposed to LPS (100 ng/ml; n=3–6 independent experiments). Values are means ± se. *P < 0.002 versus diluent by ANOVA interaction.

