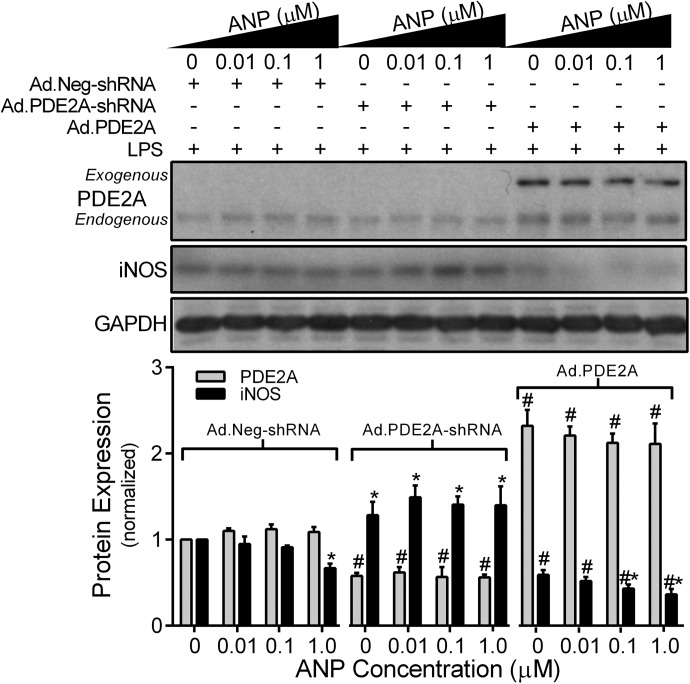
Figure 5. Effect of down- or up-regulating PDE2A expression on MH-S macrophage PDE2A and iNOS expression by Western blot with densitometric analysis measured after 12 h of exposure to an increasing concentration of ANP administered with LPS (100 ng/ml).
Ad.Neg-shRNA, Ad.PDE2A-shRNA, or Ad.PDE2A were administered 48 h before ANP/LPS. The PDE2A and iNOS protein levels are normalized to GAPDH loading control and then to control Ad treatment in the absence of ANP (n=8 independent experiments). Values are means ± se. *P < 0.05 versus 0 ANP value within each adenoviral treatment group; #P < 0.001 versus Ad.Neg-shRNA treatment groups.

