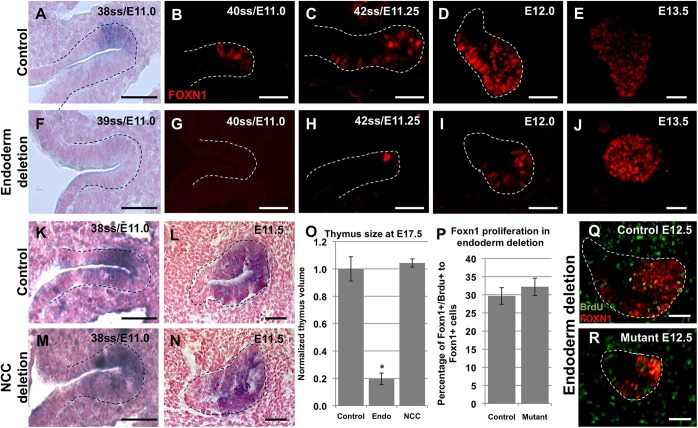
Fig. 6.
Delayed Foxn1 expression and thymus hypoplasia after endoderm-specific deletion. Paraffin sections of control (Hoxa3+/fx;Foxa2CreERT2/+) and endoderm deletion (Hoxa3fx/−;Foxa2CreERT2/+) embryos stained with a Foxn1 riboprobe using ISH at E11.0 (n=2) (A,F) or with an antibody against FOXN1 between E11.0 and E13.5 (n=3-5 per stage) (B-E,G-J). (K-N) ISH on paraffin sections from control (Hoxa3fx/−;Wnt1Cre0/0) and NCC deletion (Hoxa3fx/−;Wnt1Cretg/0) embryos for Foxn1 (n=2). (O) Bar chart showing thymus size at E17.5 in the control (Hoxa3+/−) (n=2), and endoderm (Endo) (Hoxa3fx/−;Foxa2CreERT2/+) (n=3) or NCC deletion mutants (Hoxa3fx/−;Wnt1Cretg/0) (n=3). *P<0.0001. (P-R) At E12.5, approximately 30% of FOXN1-positive cells were proliferating in both control (Hoxa3+/fx;Foxa2CreERT2/+ or Hoxa3+/fx;Foxa2+/+) (n=3) and endoderm deletion (mutant) (Hoxa3fx/−; Foxa2CreERT2/+) (n=3) embryos. The third pharyngeal pouch is outlined in all panels. All sections are sagittal and anterior is towards the top of the image. ss, somite stage. Scale bars: 40 µm.

