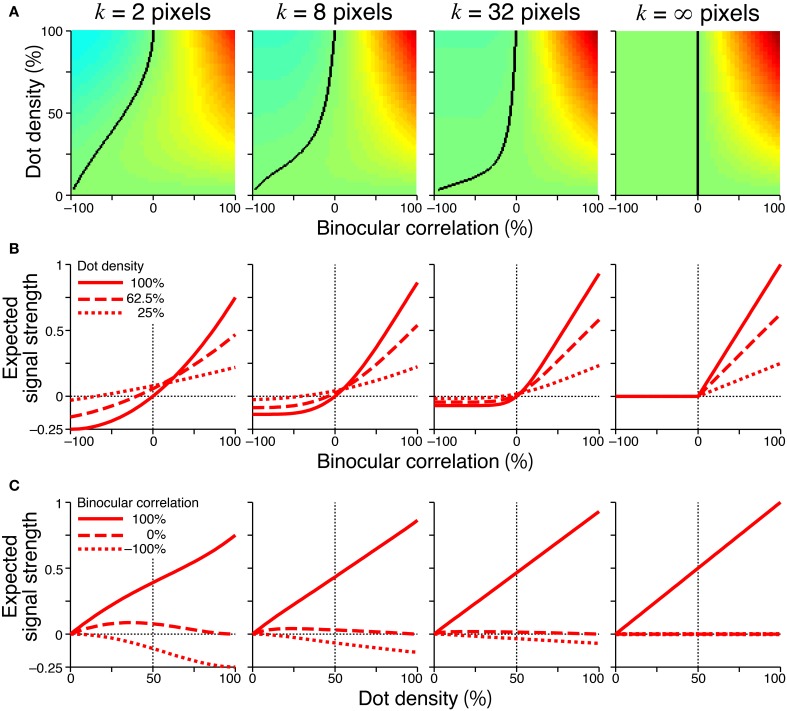
Figure 6.
Signal strength for generalized cross-matching. Spatial averages were taken at various window sizes (2, 8, 32, and infinite pixels from the left to right columns) before thresholding nonlinearity. Other figure conventions are the same as those used in Figure 4, including the color scale of (A), except for the y-axis range of (B,C). In the rightmost panel of (A), the solid black line indicates the boundary between positive and zero signal strengths, and the left part of the line is all zero.

