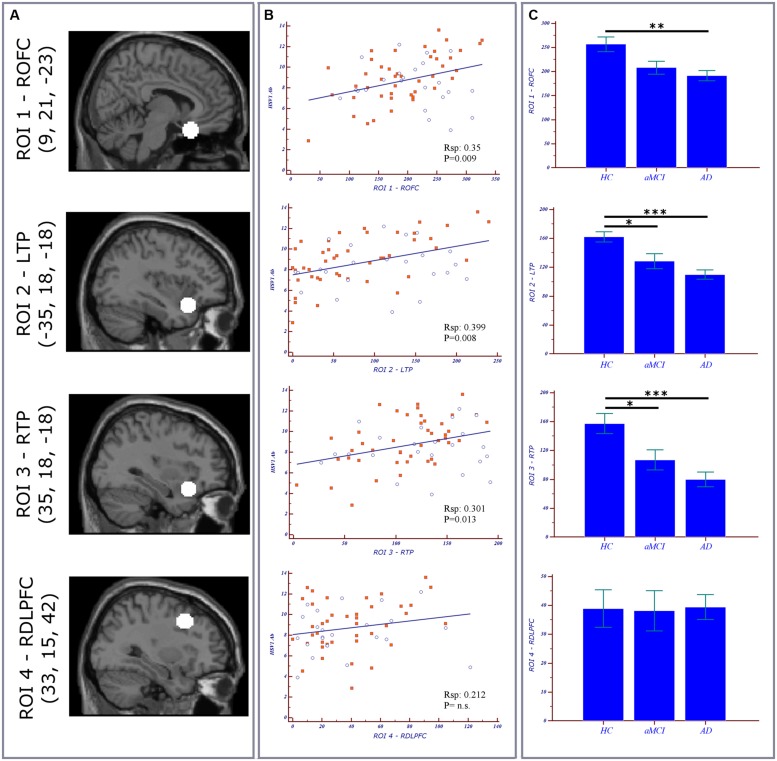
FIGURE 1.
Region of interest (ROI) Analysis. (A) ROIs location and relative MNI coordinates (x,y,z). (B) Scatterplots representing the correlation between ROIs volumes of both MCI (blue circles) and AD (orange squares) subjects vs. herpes simplex virus 1 (HSV-1)-specific Ab titers. (C) Bar charts and error bars representing ROI volumes (mean with SEM) in the three groups. Post hoc results are illustrated (*p < 0.05; **p < 0.01; ***p < 0.001). ROFC, right orbitofrontal cortex; LTP, left temporal lobe; RTL, right temporal lobe; RDLPFC, right dorsolateral prefrontal cortex; AD, Alzheimer’s disease; aMCI, amnestic mild cognitive impairment; RSp, Spearman correlation coefficient.

