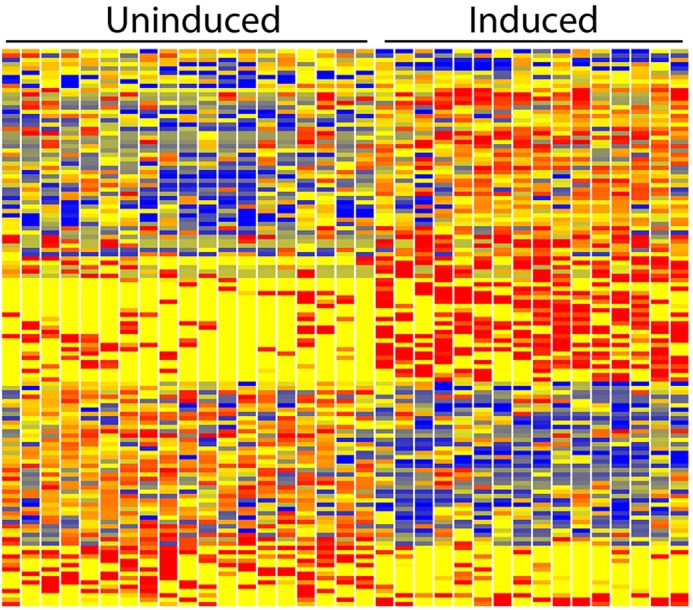
Fig. 5.

Heatmap of differential gene expression of E12.5 uninduced and induced CM single cells. Of interest, at this stage the induction process shows a combination of both strong gene activation and repression. This is in contrast with E11.5, where the predominant feature was gene repression. Red, blue and yellow indicate high, low and intermediate expression levels.
