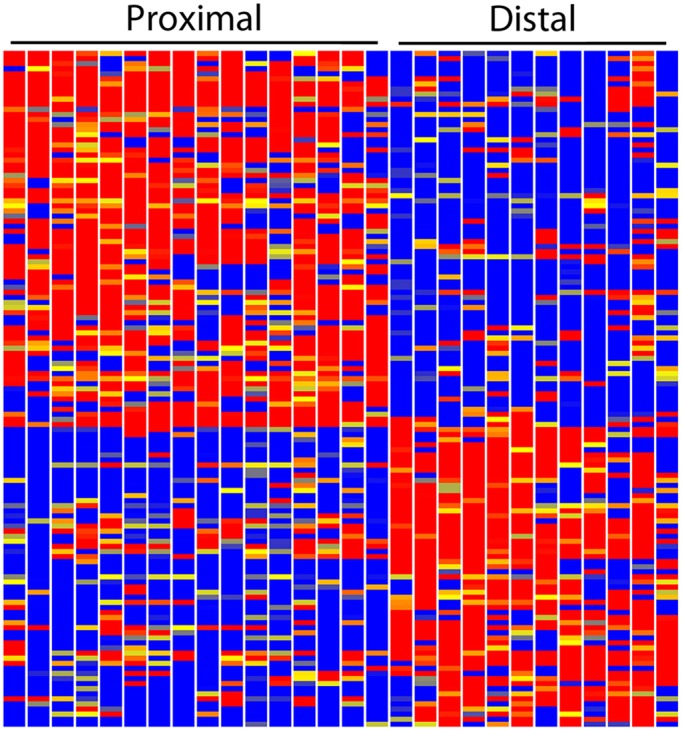
Fig. 6.

Heatmap showing polarized gene expression of the renal vesicle. The 16 single-cell replicates of the proximal RV and the 12 single-cell replicates of the distal RV show remarkably consistent differences in the expression levels of a large number of genes. Red, blue and yellow indicate high, low and intermediate expression levels.
