Fig. 3.
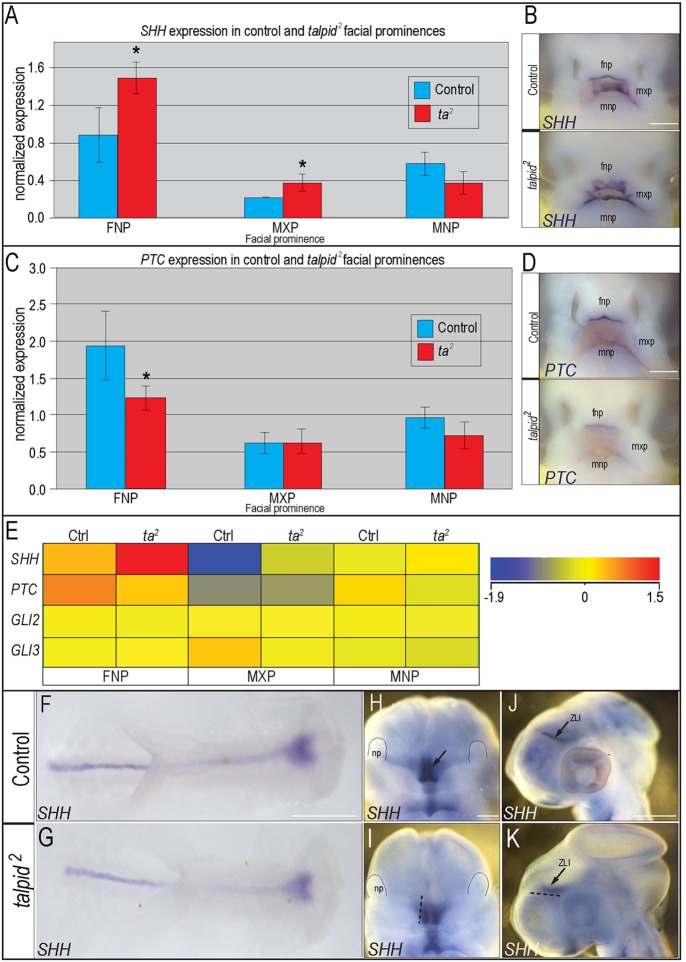
SHH signaling is disrupted in the developing face and brain of talpid2 mutants. (A) qRT-PCR for SHH in frontonasal (FNP), maxillary (MXP) and mandibular (MNP) prominences in control and talpid2 embryos; *P<0.05. Data are mean±s.e.m. (B) In situ hybridization for SHH in control (n=7) and talpid2 (n=3) HH25 embryos. (C) qRT-PCR for PTC; *P<0.03. Data are mean±s.e.m. (D) In situ hybridization for PTC in control (n=7) and talpid2 (n=3) HH25 embryos. (E) RNA-seq results for SHH, PTC, GLI2 and GLI3 expression. (F-K) In situ hybridization for SHH in control and talpid2 embryos. (F,G) Dorsal view of control (n=11) and talpid2 (n=9) HH10 embryos. (H-K) Frontal and lateral views of control (n=8) and talpid2 (n=4) HH20 embryos. Dotted black lines in I,K represent the size of the expression domain in the control embryo (H,J). ZLI, zona limitans intrathalamica. Scale bars: 250 µm in B,D; 600 µm in F,G; 100 µm in H,I; 200 µm in J,K.

