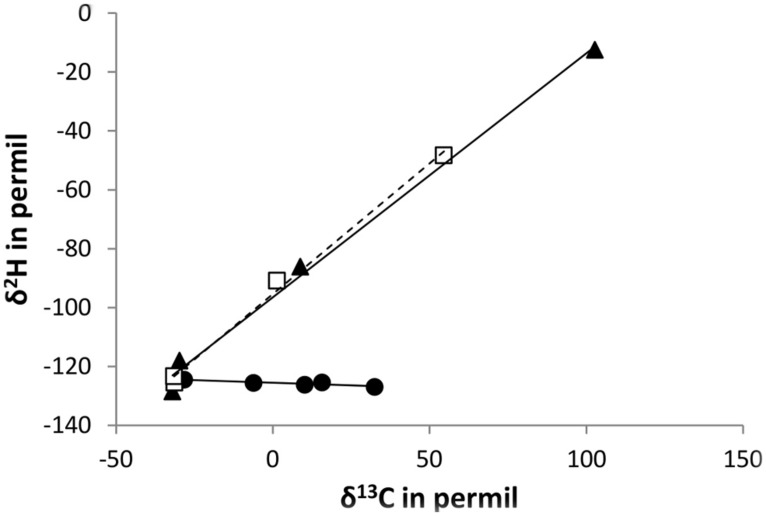
FIGURE 4.
Changes in carbon and hydrogen isotope ratios for degradation of chloromethane by L. methylohalidivorans MB2 (•), M. extorquens CM4 (□), and Hyphomicrobium sp. MC1 ( ) at different time points during growth (increase in time from left to right of the graph). Lines (slope = -0.03 (R2: 0.8014) for strain MB2, slope = 0.89 (R2: 0.9954) for strain CM4, and slope = 0.83 (R2: 0.9939) for strain MC1, respectively) represent best fit regressions.

