Figure 1.

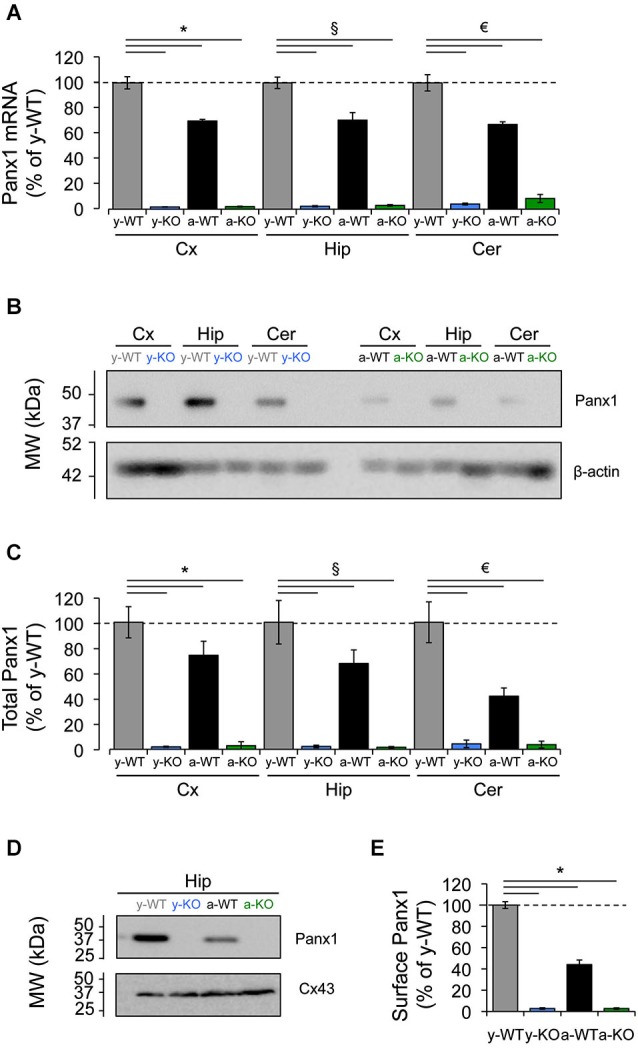
Decreased expression of Panx1 transcript and protein in the adult mice brain. (A) Quantitative RT-PCR analysis of relative abundance of Panx1 mRNA in the cerebral cortex (Cx), hippocampus (Hip), and cerebellum (Cer) from young wild type (y-WT, gray), young Panx1 knockout (y-KO, blue), adult wild type (a-WT, black) and adult Panx1 knockout mice (a-KO, green). The transcript values were normalized to the levels of cyclophilin (Cyp1) (N = 4). (B) Representative Western blot showing the expression levels of Panx1 protein in homogenates of cerebral cortex (Cx), hippocampus (Hip) and cerebellum (Cer) of young or adult animals. β-actin expression in samples was used for loading control. (C) Quantification of Panx1 protein expression by densitometry analysis of bands from four independent Western blots (N = 4), including the one shown in (B). Values were normalized to β-actin loading control. (D) Western blots of plasma membrane biotinylated proteins of hippocampal slices probed with anti-Panx1 and anti-Cx43 antibodies. (E) Quantification of protein expression by densitometry analysis of Panx1 bands from three independent Western blots (N = 3) like the one shown in (D). All data are plotted as mean ± SEM related to results of y-WT animals. Statistical differences were calculated using 2 way-ANOVA, followed by post hoc Bonferroni’s test. * p < 0.05 vs. y-WT Cx; § p < 0.05 vs. y-WT Hip; € p < 0.05 vs. y-WT Cer.
