
Figure 6.
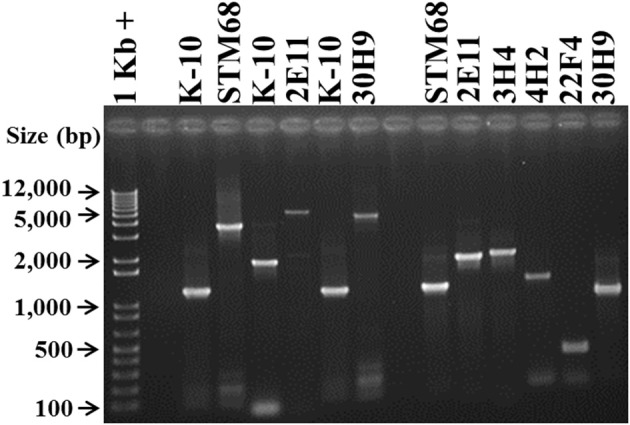
Analysis of MAP Tn5367 (3,381 bp) and Tn5370 (2295 bp) insertion mutants by PCR. Lane 1, Invitrogen TrackIt™ 1 Kb Plus DNA Ladder; Lanes 2 and 9, empty. Amplicons for the DNA template-primer combinations and corresponding sizes are: Lanes 3 and 7, K-10 with MAP1566-F and MAP1566-R, 1179 bp; Lane 4, STM68 with MAP1566-F and MAP1566-R, 3474 bp; Lane 5, K-10 with 2E11-IP-F and 2E11-IP-R, 1845 bp; Lane 6, 2E11 with 2E11-IP-F and 2E11-IP-R, 5226 bp; Lane 8, 30H9 MAP1566-F and MAP1566-R, 4560 bp; Lane 10, STM68 with MAP1566-F and AMT32, 1160 bp; Lane 11, 2E11 with 2E11-IP-F and AMT32, 1890 bp; Lane 12, 3H4 with 3H4-R and AMT32, 1974 bp; Lane 13, 4H2 with 4H2-F and AMT32, 1431 bp; Lane 14, 22F4 with 22F4-F and AMT32, 561 bp; Lane 15, 30H9 with MAP1566-R and AMT32, 941 bp. Relevant band sizes (bp) for the DNA ladder are displayed to the left.