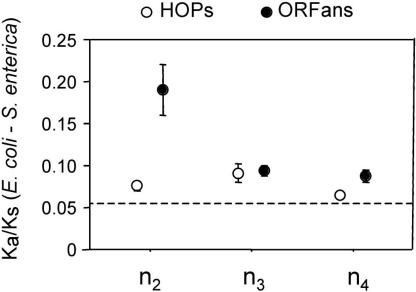
Figure 3.
Average Ka/Ks ratios for ORFans (black circles) and HOPs (open circles) restricted to clades of increasing phylogenetic depth (n2-n4). All calculations of Ka and Ks are based on E. coli and S. enterica orthologs. The dashed line corresponds to the average Ka /Ks value for native genes of E. coli and S. enterica. Bars represent one standard error.

