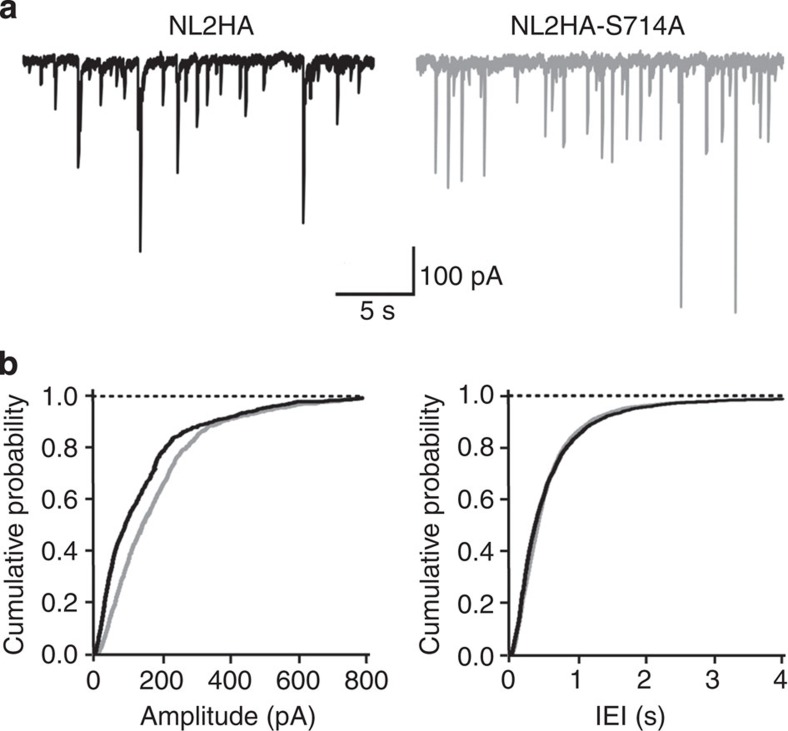
Figure 7. Changes in amplitude of sIPSCs involve the interaction of Pin1 with NL2.
(a) Samples traces of sIPSCs recorded from hippocampal neurons in culture expressing either the NL2HA or the NL2HA-S714A mutation. (b) Amplitude and inter-event interval (IEI) plots of sIPSCs recorded in cells transfected either with the NL2HA (black; n=7) or the NL2HA-S714A point mutant (grey; n=12). P<0.05; Kolmogorov–Smirnov test. Note the shift to the right of the cumulative amplitude distribution curve obtained from cells transfected with the mutant as compared to controls.

