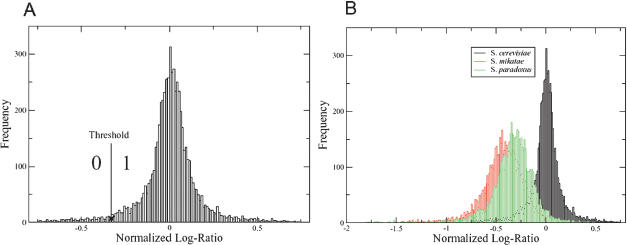
Figure 1.
Stages of phylogeny construction. (A) A histogram of log. ratios (normalized) from the self–self hybridizations. The normalized log. ratio is used as a measure of divergence, for each particular ORF, from the reference species S. cerevisiae FY1679. The threshold, shown by the solid arrow, is chosen so that few ORFs in the self–self hybridizations have a normalized log. ratio below the threshold. (B) Histograms of normalized log. ratios from other species in comparison to the self–self data.

