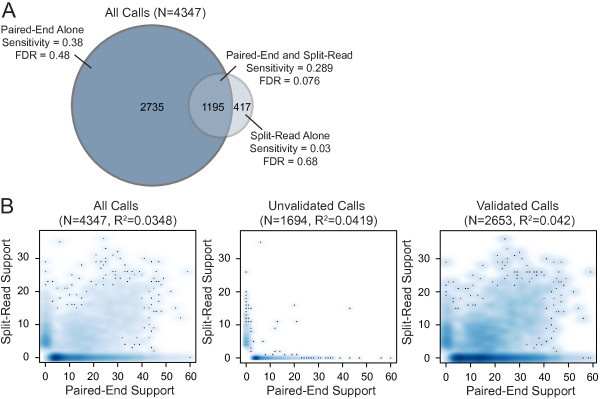
Figure 6.

Relationship between paired-end and split-read signals for the NA12878 callset. (A) Venn diagram showing the total number of calls identified by paired-end alignments alone (left), by split-read alignments alone (right), or by both (center). Shown are the total number of calls, the sensitivity, and the FDR. Sensitivity and FDR are calculated precisely as in Figure 5. (B) Scatter plots showing the relationship between the number of split-reads (y-axis) and paired-end reads (x-axis) that identify each SV breakpoint in the entire callset (left), the unvalidated SV calls (center) and the validated SV calls (right). The number of variants in each category and the R2 values are shown above each plot. Note that one unvalidated call is not visible in these plots due to cropping; it was identified by 236 split reads and 0 paired-end reads.
