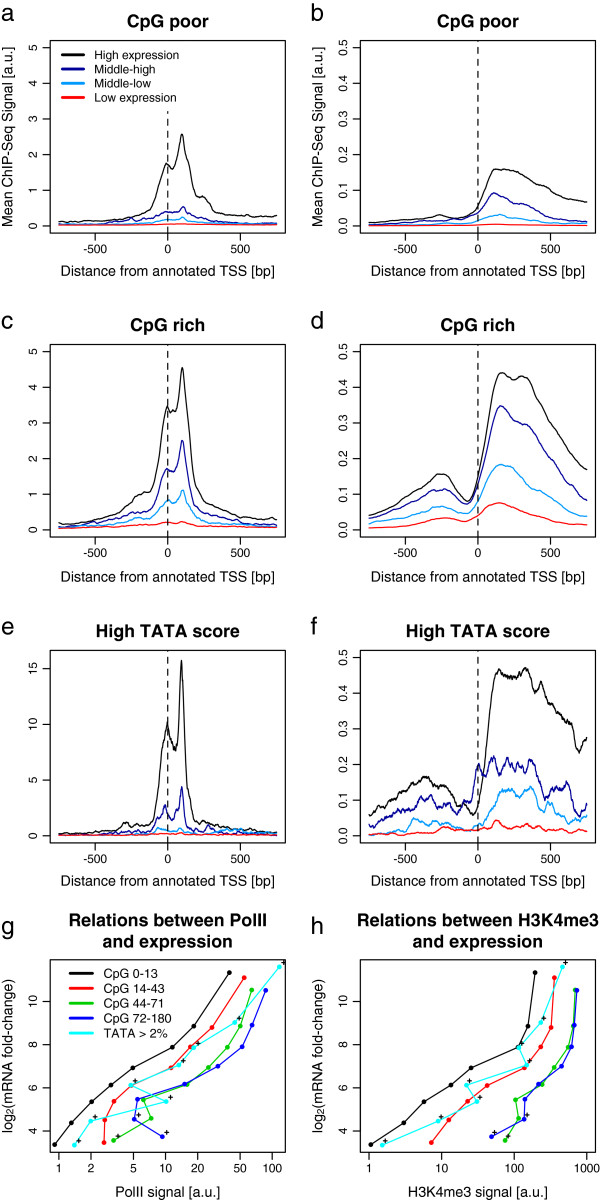
Figure 6.

PolII and H3K4me3 occupancy at TSSs correlate with CpG number, TATA score and mRNA expression. (a–f) Genomic profiles of ChIP-seq around TSSs for PolII (a, c, e) and H3K4me3 (b, d, f). Expression thresholds on microarray data are 6.0 and 8.0 as in Figure 1. (a, b) CpG-poor promoters have less than 50 CpG counts in TSS ± 1 kb (3,873 genes). (c, d) CpG-rich promoters have more than 50 CpG counts (2,520 genes). (f) High TATA score promoters have the top 2% of TATA scores (98 genes). (g, h) Microarray signal as a function of PolII ChIP-seq signals (g) and H3K4me3 ChIP-seq signals (h) within 1 kb of a TSS stratified by the CpG content of promoter sequences (see Materials and methods). A cross indicates that the point represents less than 1% of all TSSs. a.u., arbitrary units.
