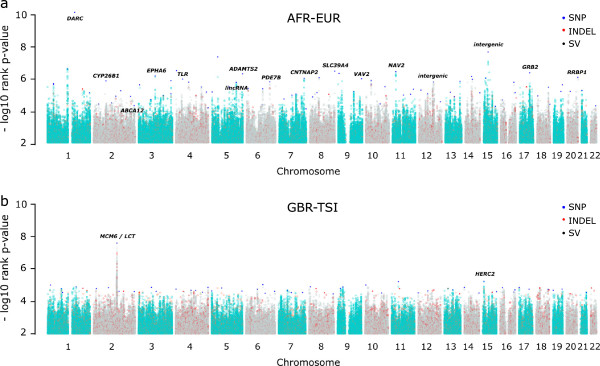
Figure 1.

Manhattan plots of rank P-values for genome-wide pairwise derived allele frequency differences (ΔDAFs). (a,b) As an example, we report here between-continental populations (AFR-EUR) (a) and within continental-populations (GBR-TSI) (b) comparisons. Only the top percentile of the 36.8 million variants is represented. Each dot represents the genome-wide ΔDAF rank P-value at a variable site between two populations. Chromosomes are represented by alternating turquoise and grey colors; red, blue and black dots represent INDEL, SNP and SV sites, respectively, that have been identified as highly differentiated (HighD sites). Gene/region names are shown for some of the top HighD sites.
