
Fig. 7.
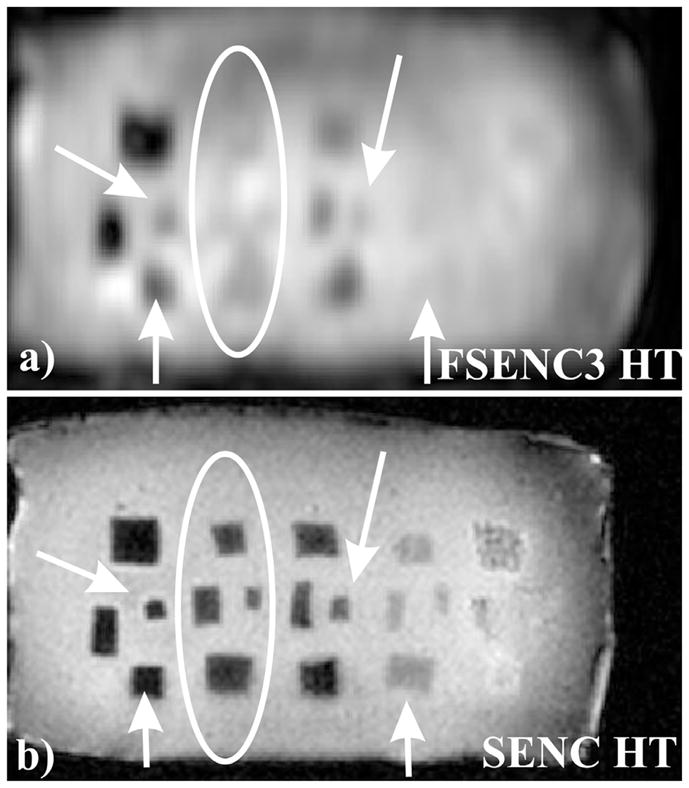
(a) T1 weighted and (b) T2 weighted images with fat suppression for phantom testing. c) SENC image of the phantom with the device operated in compress and hold mode. d, f, h, j) SENC strain images with different scanning resolutions of our phantom. e, g, i) FSENC strain images with different scanning resolutions. Dotted white rectangles separate the groups A, B and C, D and E of masses. Arrows point to missing (MRI invisible) masses on FSENC images.