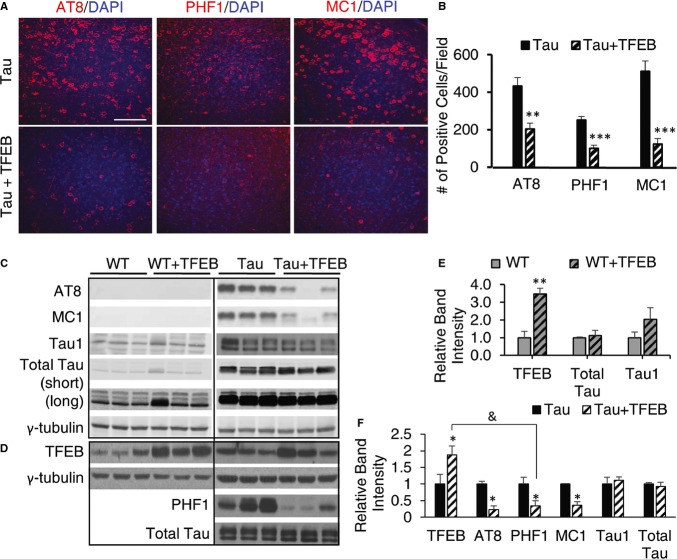
Figure 1. Potent reduction of pTau proteins by AAV-mediated TFEB expression.
- A Immunofluorescence staining of cortex of 4-month-old rTg4510 mice either untreated (Tau) or injected with TFEB (Tau + TFEB) at P0 using phospho-Tau antibodies AT8 (S202/T205) and PHF1 (S396/S404) or conformation-specific antibody MC1 and counter-stained with DAPI. AAV-TFEB was injected at P0 and mice were analyzed at 4 months. Scale bar: 200 μm.
- B Quantification of staining intensities. Student's t-test was performed to analyze the significance. n = 5 mice/genotype/treatment group. **P = 0.0011, ***P = 6.85 × 10⁻⁵, and ***P = 9.33 × 10⁻⁵ for AT8, PHF1 and MC1, respectively. Each bar represents average ± s.e.m.
- C Western blot analysis of detergent-extracted brain lysates using anti-total Tau, Tau1, AT8 or MC1 antibodies. WT: wild-type; WT + TFEB: wide-type mice injected with TFEB; Tau: rTg4510 transgenic mice; Tau + TFEB: rTg4510 transgenic mice injected with TFEB. Two exposures were displayed for total Tau: the short exposure was used for quantification of Tau transgenic samples; the long exposure was used for side-by-side comparisons of the total Tau levels in WT and Tau mice and for quantification of WT total Tau. γ-tubulin was used as a loading control.
- D Western blot analysis of TFEB expression in 4-month-old WT or Tau mice with (+TFEB) or without AAV-TFEB P0 injection (the same as in A and C but from another independent batch of experiments). PHF1 and total Tau antibodies were used to blot the Tau transgenic lysates for correlation with TFEB levels.
- E, F Quantification of relative band intensities in WT (E) or Tau (F) mice. Student's t-test shows that TFEB protein levels are significantly increased in WT + TFEB vs WT (**P = 0.0026) and in Tau + TFEB vs Tau (*P = 0.047). AT8, PHF1 and MC1 levels are significantly reduced in Tau + TFEB vs Tau (*P = 0.032, 0.041, 0.040, respectively). &, significant correlation between TFEB protein levels and PHF-1 was determined using Pearson Product Moment Correlation test (P = 0.0044). n = 3/group/experiment. Each bar represents average ± s.e.m.
Source data are available online for this figure.

