
Figure 2. Biochemical analysis of TFEB-mediated reduction of pTau.
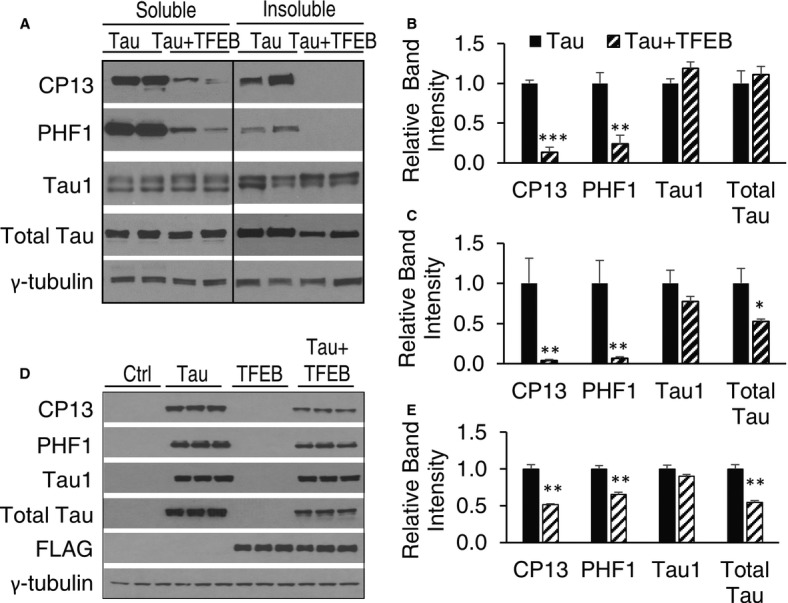
- A Western blot analysis of detergent-free (Soluble) and sarkosyl-insoluble (Insoluble) preparations of total (total Tau), unphosphorylated (Tau1) or CP13- (S202/T205) and PHF1-positive pTau species in 4-month-old Tau or Tau + TFEB mice with P0 injection. γ-tubulin was used as a loading control.
- B, C Quantification of relative band intensities in soluble (B) and insoluble (C) fractions. n = 3 mice/genotype/treatment group. CP13 and PHF1 are significantly reduced in both soluble and insoluble fractions (Student's t-test, ***P = 0.00072 and **P = 0.004, for B; and **P = 0.007 and **P = 0.009 for C).
- D Western blot analysis of total Tau, unphosphorylated Tau (Tau1) and CP13- or PHF1-positive pTau levels in response to doxycycline induction (Tau) and/or TFEB-FLAG transfection (TFEB) in T40PL cell line. Ctrl: untreated; Tau: 0.5 μg/ml doxycycline treated for 48 h; TFEB: TFEB transfected for 48 h; Tau + TFEB: combined TFEB transfection and DOX treatment. FLAG: anti-FLAG antibody blotting for TFEB expression. γ-tubulin was used as a loading control.
- E Quantification of relative band intensities. CP13, PHF1 and total Tau are significantly reduced by TFEB transfection (Student's t-test, n = 3, **P = 0.0012, 0.0040, and 0.0019, respectively). Each bar represents average ± s.e.m.
Source data are available online for this figure.