
Figure 3. Intracellular clearance of pTau pathology by TFEB.
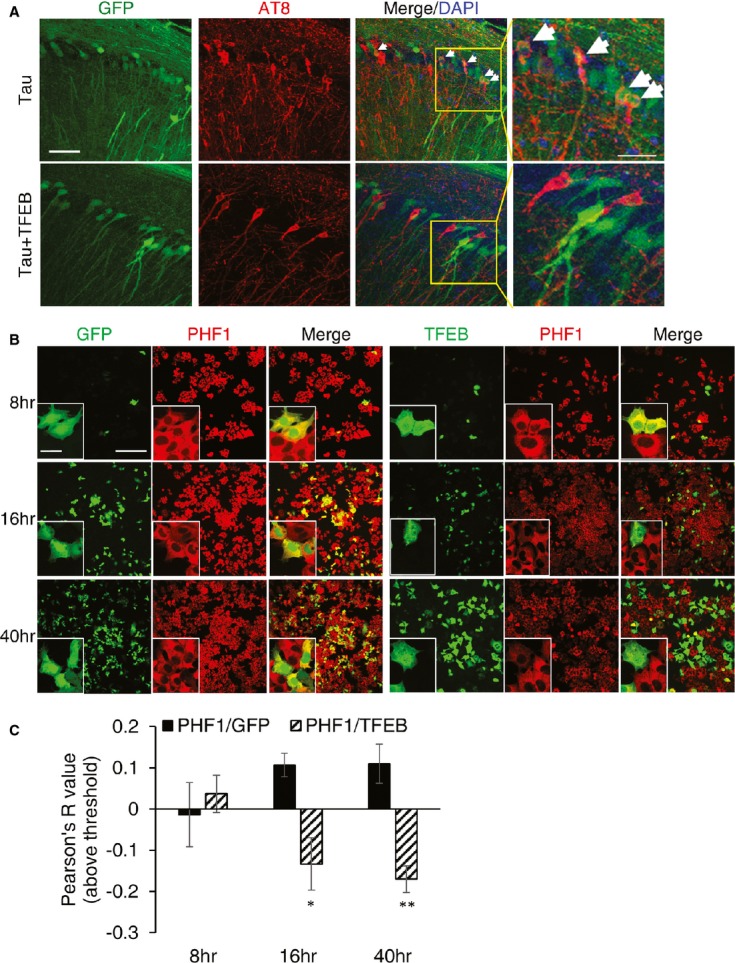
- Immunohistochemical staining of hippocampus of rTg4510 (Tau) mice injected with AAV-GFP (Tau) or AAV-TFEB/AAV-GFP (Tau + TFEB) at P0 and analyzed at 4 months. Images are displayed as GFP only (GFP), AT8 only (AT8) or overlay of GFP/AT8/DAPI (Merge/DAPI). Right panels are enlarged images of the bracketed areas. Arrowheads indicate GFP/AT8-double-positive cells only in GFP-injected mice. Scale bar: 50 μm. n = 2 for AAV-GFP and n = 5 for AAV-TFEB/AAV-GFP; 4–5 sections/mouse were examined.
- Fluorescence images of GFP and immunofluorescence images of anti-FLAG compared with immunofluorescence images of anti-PHF1 in GFP or TFEB transfected and doxycycline induced T40PL cell line at 8, 16 or 40 h post-transfection. Merge: Overlay of GFP or TFEB-FLAG with PHF1. Insets are higher resolution images documenting that whereas overlapping GFP and PHF1 immunoreactivity can be observed at all the time points, TFEB- and PHF1-double-positive cells can only be detected at 8 h but not later times. Scale bar: 200 μm; in inset: 50 μM.
- Pearson correlation coefficients (Pearson R-values) showing no correlation between GFP and PHF1 (PHF1/GFP) at any time points, but negative correlation between TFEB and PHF1 (PHF1/TFEB) starting at 16 h and persisting to 40 h (Student's t-test, n = 4, *P = 0.026 and **P = 0.008 for 16 and 40 h, respectively, comparing R-values for GFP/PHF1 with TFEB/PHF1). The whole view field of eight confocal projection slices per view field, four view fields per time point per transfection was used for analysis. Bar graph represents average ± s.e.m.