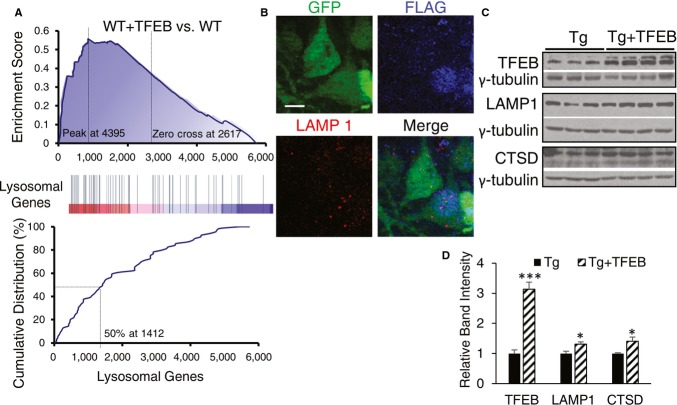
Figure 6. Analysis of TFEB-mediated lysosomal gene activation in vivo.
- Gene set enrichment analysis (GSEA) of transcriptome changes in TFEB-injected vs. uninjected wild-type (WT + TFEB vs. WT) mice. GSEA of genes annotated as participating in the lysosomal function are reported. The upper panel shows the enrichment generated by GSEA of ranked gene expression data (left in upper panel and red in middle panel: upregulated; right in upper panel and blue in middle panel: downregulated). Peak value corresponds to the point (along the ranked microarray) where the enrichment score (ES) meets its highest value, while the zero value indicates the boundary (along the ranked microarray) between positive fold change and negative fold change. In the middle panel, vertical blue bars indicate the position of lysosomal genes within the ranked list. Lower panel shows the cumulative distribution of lysosomal genes within the ranked lists. The ranking positions that include 50% of lysosomal genes are indicated. The analysis shows that lysosomal genes have a significant global shift toward upregulated genes in TFEB-injected mice compared with uninjected littermates (ES = 0.56, P = 0.0029). n = 4 mice/group.
- Representative image of Tau mice coinjected with TFEB-FLAG/GFP and immunostained with anti-FLAG and LAMP1 antibodies. Merge image highlights that nuclear TFEB-FLAG is correlated with higher LAMP1. Scale bar: 10 μm.
- Western blot analysis of TFEB, LAMP1 and CTSD expression in Tau mice with (+TFEB) or without AAV-TFEB adult injection.
- Quantification of relative band intensities of (C). n = 3 and 4 per group. TFEB protein levels are significantly increased in Tg + TFEB vs Tg (***P = 0.00013) along with LAMP1 protein levels (*P = 0.013) and CTSD protein levels (*P = 0.028), Student's t-test. Each bar represents average ± s.e.m.
Source data are available online for this figure.

