
Figure 7. Analysis of TFEB-mediated autophagy and lysosomal pathway in vitro.
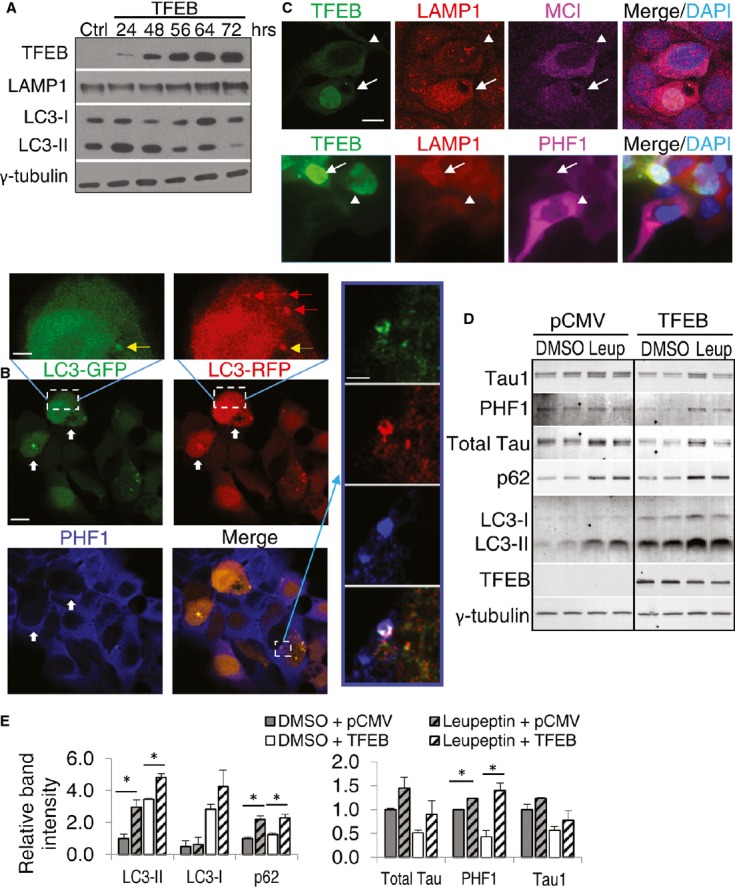
- Western blot analysis of Lamp1 and LC3-I and LC3-II levels in T40PL cells transfected with TFEB-FLAG and harvested at times indicated. γ-tubulin was used as a loading control. Ctrl: untransfected.
- Fluorescent images of T40PL cells transfected with TFEB and RFP-GFP-LC3. Thick white arrows indicate cells with significant LC3 puncta and lower PHF1 compared with nearby cells. Images on the upper and right are higher magnification views of the bracketed area of the LC3-GFP and LC3-RFP or Merge panels, respectively. RFP-only autolysosomes are marked by red arrows; GFP/RFP double-positive puncta representing an autophagosome is shown in yellow (upper inset). Right insets highlight a cell with colocalization of GFP/RFP-positive autophagosome with PHF1. Scale bar: 10 μm; in inset: 2.5 μm.
- Immunofluorescence images of T40PL cells transfected with TFEB and stained with anti-LAMP1/MC1 (top) or PHF1 (bottom). Arrow marks cells with nuclear TFEB and its correlation with higher LAMP1 and lower MC1 (top) or PHF1 (bottom) stainings. Arrowhead indicates nearby cells with cytoplasmic TFEB and opposite LAMP1 and MC1/PHF1 patterns. Scale bar: 10 μm.
- Western blot analysis of T40PL cells transfected with either pCMV or TFEB, allowed to recover for 24 h, and then treated with 0.5 μg/ml doxycycline and either DMSO or 50-μM Leupeptin for 48 h prior to lysis. Black line denotes cropped lanes from a single immunoblot.
- Quantization of the autophagy markers LC3-I, LC3-II (pCMV vs pCMV+Leupeptin P = 0.032, TFEB vs TFEB+Leupeptin P = 0.014), and p62 (pCMV vs pCMV+Leupeptin P = 0.019, TFEB vs TFEB+Leupeptin P = 0.024), and Tau species markers Tau1, PHF1 (pCMV vs pCMV+Leupeptin P = 0.00082, TFEB vs TFEB+Leupeptin P = 0.022), and total Tau normalized for loading to γ-tubulin from (D). P-values determined by t-test, n = 4. (*P < 0.05) Each bar represents average ± s.e.m.
Source data are available online for this figure.