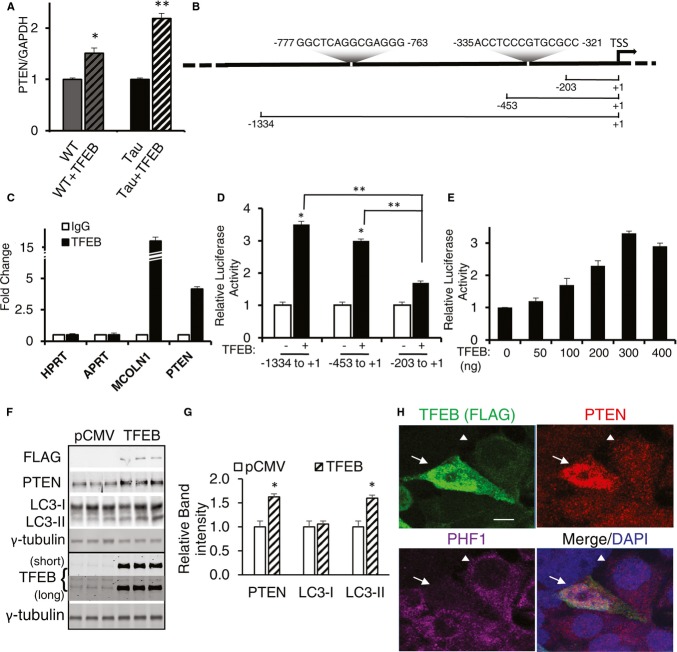
Figure 8. PTEN is a direct target of TFEB.
- qRT-PCR analysis of PTEN levels as a function of TFEB treatment in WT or Tau mice. n = 3 mice/genotype/treatment group in triplicates. *P = 0.027 and **P = 0.01 for WT vs WT + TFEB and Tau vs Tau + TFEB, respectively (Student's t-test).
- Putative CLEAR sequences in the PTEN promoter and their positions. TSS: translation start site. −203 to +1, −453 to +1 and −1334 to +1: PTEN promoter fragments linked to the luciferase reporter.
- ChIP analysis of TFEB binding. HPRT and APRT: negative controls; MCOLN1: positive control. Open bar: IgG control; filled bar: TFEB-FLAG IP. The experiment was done two times each in triplicates.
- Normalized luciferase activity by transfecting 300 ng of each PTEN-luciferase reporter. Open bar: vector transfection control; filled bar: TFEB transfected. Student's t-test, n = 4; *P = 0.01; **P = 0.005
- Dose-dependent luciferase activities in response to increasing concentrations of TFEB using the (−1344 to +1) PTEN-luciferase reporter. The experiment was done three times each in triplicates.
- Western blot analysis of PTEN and LC3 expression in T40PL cells transfected with either pCMV or TFEB.
- Quantization of blots in F and normalized for loading to γ-tubulin. PTEN and LC3-II are significantly increased in cells transfected with TFEB with *P = 0.032 and 0.036, respectively (Student's t-test, n = 3).
- Representative immunofluorescent images of T40PL cells transfected with TFEB and triple staining for TFEB (FLAG), PTEN and PHF1. Arrow marks cell with higher TFEB and PTEN is correlated with lower PHF1. Arrowhead indicates nearby cell with opposite TFEB/PTEN/PHF1 patterns. Scale bar: 10 μm. Each bar represents average ± s.e.m.
Source data are available online for this figure.

