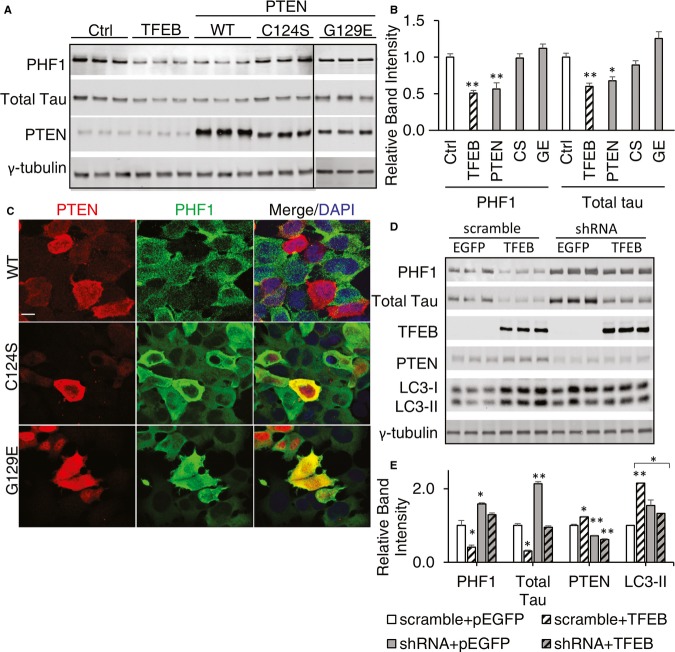
Figure 9. TFEB mediates pTau reduction in a PTEN-dependent manner.
- Western blot analysis of total Tau and PHF1-positive pTau levels as a function of wild-type or the C124S or G129E mutant PTEN expression. Empty vector (Ctrl)- or TFEB-transfected cells were used as negative and positive controls, respectively. γ-tubulin was used as a loading control.
- Quantization of blots in A and normalized for loading to γ-tubulin. TFEB and PTEN transfection significantly reduced pTau as probed by PHF1 (P = 0.0095 and 0.0092, respectively), as well as total Tau (P = 0.0052 and 0.034, respectively), n = 3, Student's t-test.
- Representative immunofluorescence imaging showing that cells with wild-type PTEN (WT), but not the C124S or G129E mutants, were correlated with reduced PHF1-positive Tau. Scale bar: 10 μm.
- Western blot analysis of total Tau, PHF1-positive pTau and LC3 levels in response to TFEB or TFEB and PTEN shRNA expression. Transfection of a scramble PTEN shRNA was used as negative controls. γ-tubulin was used as a loading control.
- Quantization of blots in D and normalized for loading to γ-tubulin. Comparing with cells transfected with scramble+pEGFP, scramble+TFEB transfection reduces PHF1 and total Tau intensity (P = 0.038 and 0.035, respectively) and increases PTEN and LC3II (P = 0.04 and 0.0076, respectively) (white slashed bars). shRNA significantly reduce PTEN when transfected with either pEGFP or TFEB (P = 0.0089 and 0.043, respectively), but TFEB's effect in reducing pTau drops from 60% reduction in the presence of scramble sequence to 30% reduction when combined with shRNA of PTEN. All statistics here are Student's t-test, n = 3. Each bar represents average ± s.e.m.
Data information: *P < 0.05, **P < 0.01, exact value described above for each analysis.Source data are available online for this figure.

