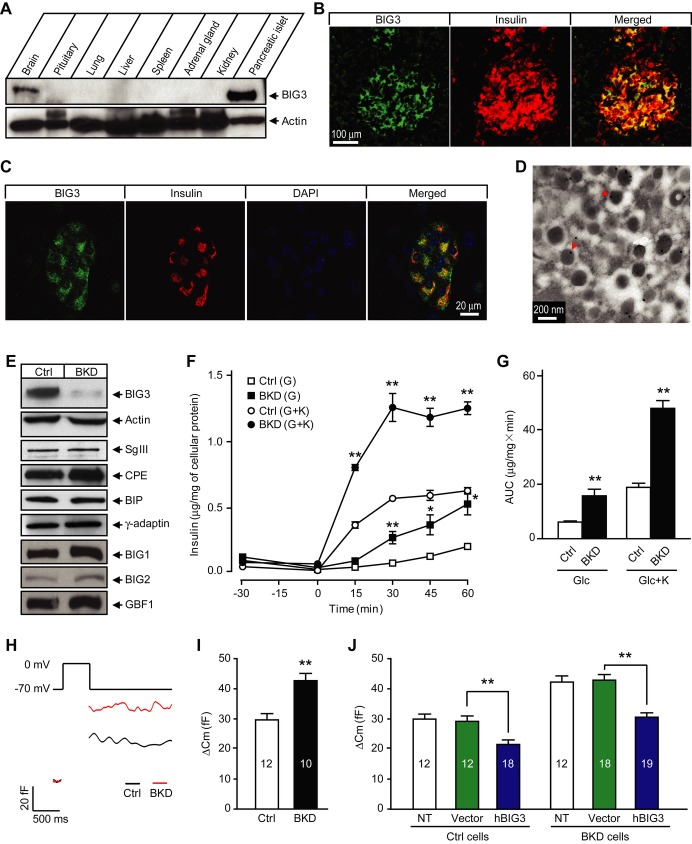
Figure 1. BIG3 associates with insulin granules and negatively regulates insulin secretion.
A BIG3 protein expression profile in adult mouse tissues.
B Immunostaining of mouse pancreas section showing BIG3 presence in insulin-positive cells.
C Immunostaining of isolated mouse islet showing co-localization of BIG3 and insulin.
D Representative electron microscopy (EM) image of mouse pancreatic β-cells. 87 ± 3% of BIG3 antibody-labeled gold particles (arrow heads) localized to insulin granules. N = 20 randomly selected images of β-cells.
E Immunoblot for BIG3 and other proteins in BIG3-knockdown (BKD) and control (Ctrl) cells.
F, G Insulin secretion time course (F) and quantification (area under curve, 0–60 min; G) in BKD and control cells under basal (2.8 mM glucose) and stimulated (16.7 mM glucose) condition in the absence or presence of 50 mM KCl (indicated as K). Data are presented as mean ± s.e.m. N = 6, *P < 0.05, **P < 0.01, t-test.
H, I Representative membrane capacitance recordings (H) and calculated exocytosis events (I) from capacitance increases in BKD and control cells. Data are presented as mean ± s.e.m. N = 10–12, **P < 0.01, t-test.
J Capacitance measurements of hBIG3 overexpression in BKD and control cells. Data are presented as mean ± s.e.m. N = 12–19, **P < 0.01, t-test.

