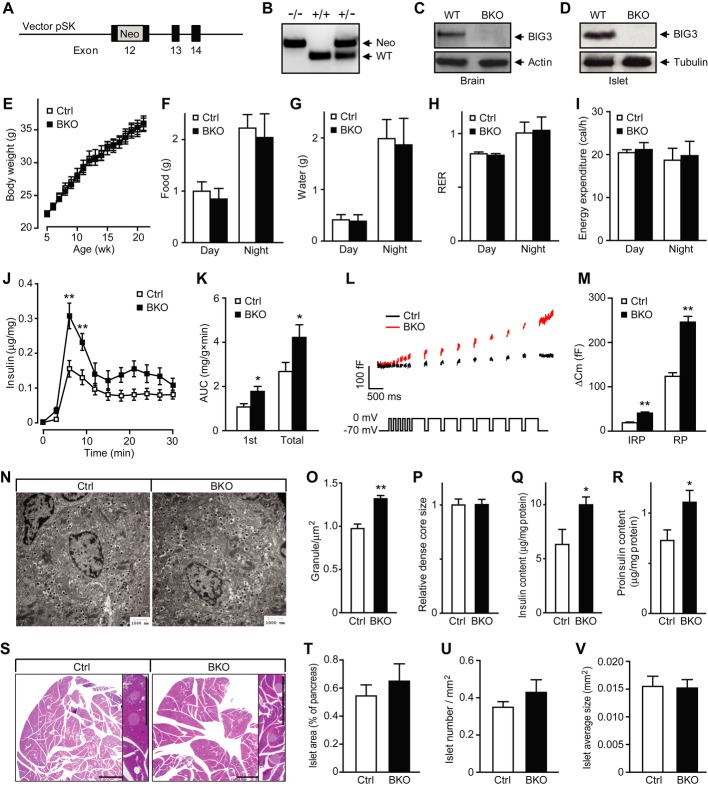
Figure 2. Increased insulin secretion and granule number in BIG3-knockout (BKO) islets.
A BKO vector: a Neo cassette was introduced into exon 12 to disrupt BIG3 gene expression.
B PCR genotyping of wild-type and mutant allele.
C, D Immunoblot of lysates of brain (C) and islets (D) from adult BKO and control mice.
E Body weights of BKO and littermate control mice. Data are presented as mean ± s.e.m. N = 11 per group, t-test.
F–I Metabolic parameters for food intake (F), water intake (G), respiratory exchange ratio (RER, H), and total energy expenditure (I). Data are presented as mean ± s.e.m. N = 6 per group, t-test.
J, K Perifusion analysis of insulin secretion time course (J) and quantification (AUC, K) of first phase and total insulin secretion in isolated islets from BKO and control mice. Data are presented as mean ± s.e.m. N = 8 from three independent islet isolations, *P < 0.05, **P < 0.01, t-test.
L, M Representative membrane capacitance recordings (L) and calculated exocytosis events (M) in BKO and control β-cells excited by five 50-ms (for measuring immediately releasable pool or IRP), and 8- to 500-ms depolarization pulses from −70 to 0 mV. RP, releasable pool. Data are presented as mean ± s.e.m. N = 16 from three independent islet isolations, **P < 0.01, t-test.
N Representative EM images of islet β-cells.
O Quantification of insulin granule density in the cytoplasm in β-cells. Data are presented as mean ± s.e.m. of 80 EM images of four mice per group, **P < 0.01, t-test.
P Size of insulin granule dense core. Data are presented as mean ± s.e.m. of 12 randomly selected EM images per group, t-test.
Q, R Insulin (Q) and (R) proinsulin content, normalized to total protein. Data are presented as mean ± s.e.m. N = 8 from three independent islet isolations, *P < 0.05, t-test.
S Representative images of H&E-stained pancreatic sections from BKO and control mice. Scale bars = 1 mm.
T–V Cumulative islet area (T), number (U), and size (V) were analyzed from 120 randomly selected pancreatic sections from four mice per group. Data are presented as mean ± s.e.m., t-test.

