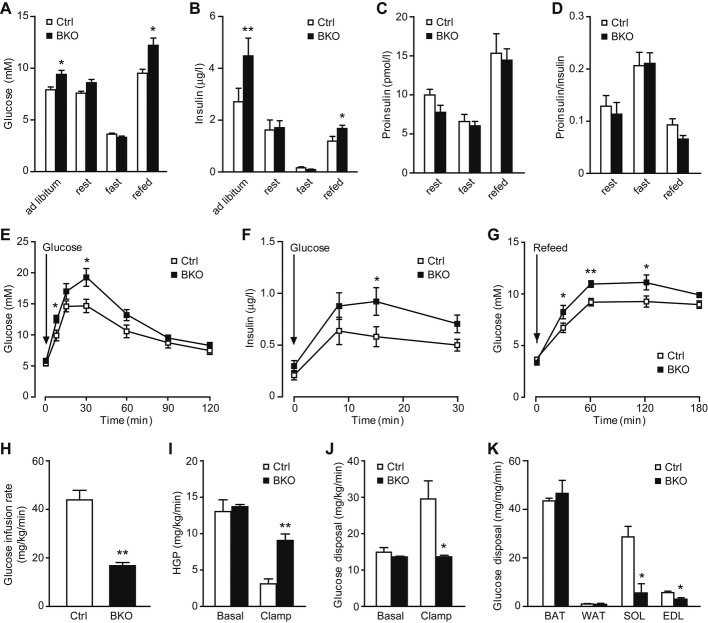
Figure 3. Hyperglycemia, hyperinsulinemia, glucose intolerance, and insulin resistance in BIG3-knockout (BKO) mice.
A, B Postprandial glycemia (A) and insulinemia (B) in BKO and control mice. Data are presented as mean ± s.e.m. N = 14 per group, *P < 0.05, **P < 0.01, t-test.
C, D Serum proinsulin (C) and proinsulin-to-insulin ratio (D) at rest, fast, and refed conditions. Data are presented as mean ± s.e.m. N = 8 per group, t-test.
E Glucose levels of oral glucose tolerance tests (OGTT) for BKO and control mice. Data are presented as mean ± s.e.m. N = 12 per group, *P < 0.05, t-test.
F Insulin response during OGTT for BKO and control mice. Data are presented as mean ± s.e.m. N = 10 per group, *P < 0.05, t-test.
G Postprandial glycemia time course after fasting-refeeding. Data are presented as mean ± s.e.m. N = 10 per group, *P < 0.05, **P < 0.01, t-test.
H–K Hyperinsulinemic-euglycemic clamp measurements of glucose infusion rate (H), hepatic glucose production (HGP, I), overall glucose uptake (J), and muscle/adipose glucose uptake (K). BAT: brown adipose tissue; WAT: white adipose tissue; SOL: soleus muscle; EDL: extensor digitorum longus muscle. Data are presented as mean ± s.e.m. N = 3 per group, *P < 0.05, **P < 0.01, t-test.

