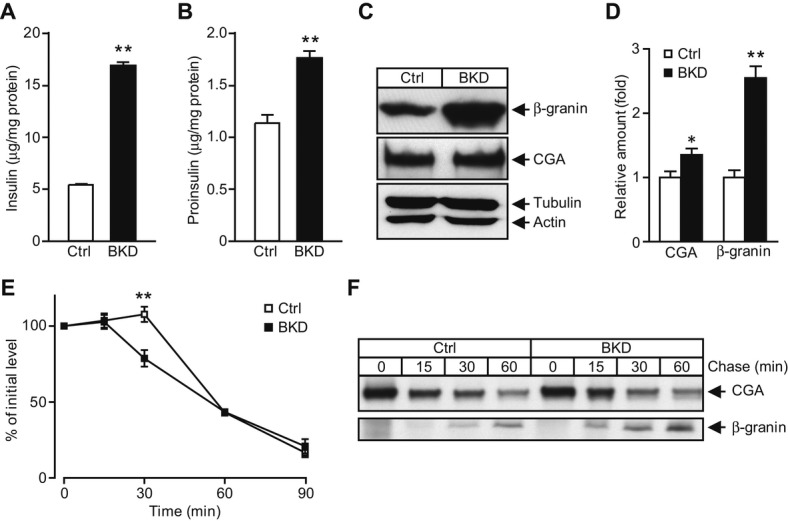
Figure 5. BIG3 negatively regulates insulin granule biogenesis.

A, B Cellular content of insulin (A) and proinsulin (B), normalized to total protein in BIG3-knockdown (BKD) and control cells. Data are presented as mean ± s.e.m. N = 6 per group, **P < 0.01, t-test.
C, D Cellular content of β-granin and chromogranin A (CGA) by immunoblotting (C) and normalized to actin (D) in BKD and control cells. Data are presented as mean ± s.e.m. N = 4 per group, *P < 0.05, **P < 0.01, t-test.
E Proinsulin processing rate, normalized to total protein and Time 0 after CHX treatment. Data are presented as mean ± s.e.m. N = 7 per group, **P < 0.01, t-test.
F Cellular CGA and β-granin processing was assessed by pulse-chase experiments, and lysates were immunoprecipitated from BKD and control cells. Representative blots from three independent experiments are shown.
