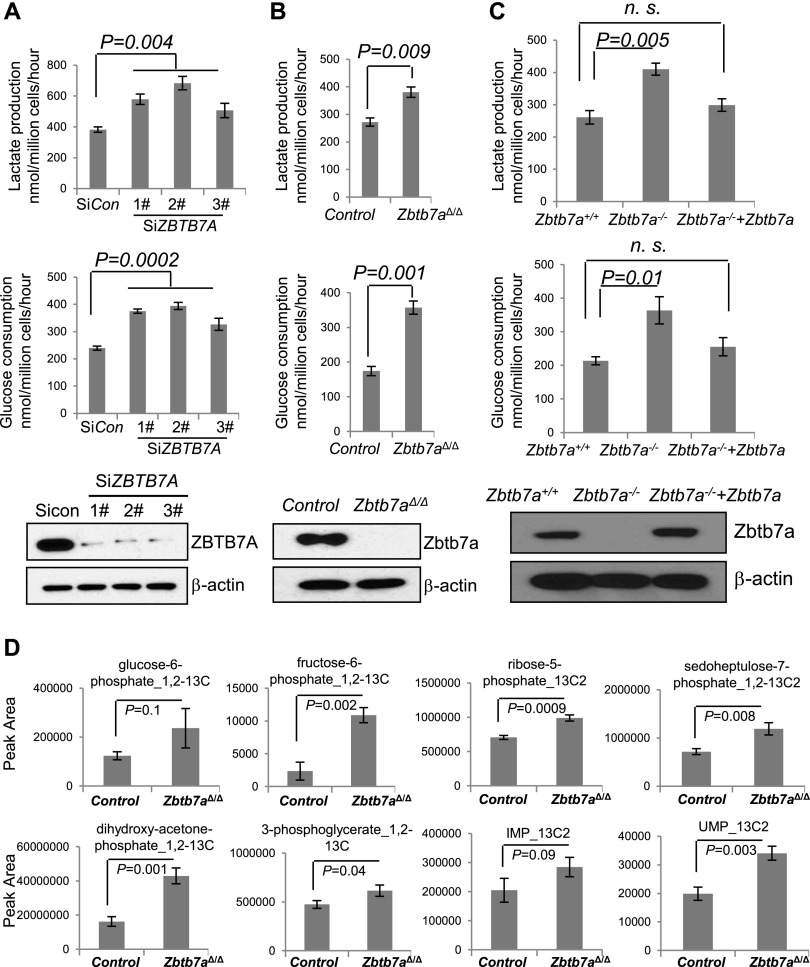
Figure 1.
ZBTB7A suppresses glycolytic metabolism in mammalian cells. (A) U2OS cells were transfected with either siControl (Sicon) or three independent ZBTB7A targeting siRNA sequences (SiZBTB7A). (Bottom) The knockdown efficiency was determined by Western analysis. Culture media from an equal number of cells were collected 48 h after transfection for lactate measurement (top) and glucose consumption determination (middle). The numbers are mean ± SD from three independent experiments. (B) Zbtb7a-deleted MEFs (Zbtb7aΔ/Δ MEF) and control MEFs were similarly analyzed for lactate production (top) and glucose consumption (middle). The numbers represent mean ± SD from three independent experiments. (Bottom) Western blot analysis was performed to determine the level of ZBTB7A expression. (C, bottom) The expression of ZBTB7A was restored in Zbtb7a−/− MEFs. Zbtb7a+/+, Zbtb7a−/−, and Zbtb7a−/−+Zbtb7a MEFs were subjected to analysis of lactate production (top) and glucose consumption (middle). Data from three experiments are presented as mean values ± SD. (D) Zbtb7a-deleted and wild-type control MEFs were incubated with [1,2-13C]-glucose for 15 min prior to metabolite extraction and targeted liquid chromatography-tandem mass spectrometry (LC-MS/MS) analysis. The ratio of 13C-labeled to unlabeled (12C) metabolites was measured by LC-MS/MS and is presented as mean ± SD over four independent samples. Metabolites with P-values for pairwise comparisons are shown.

