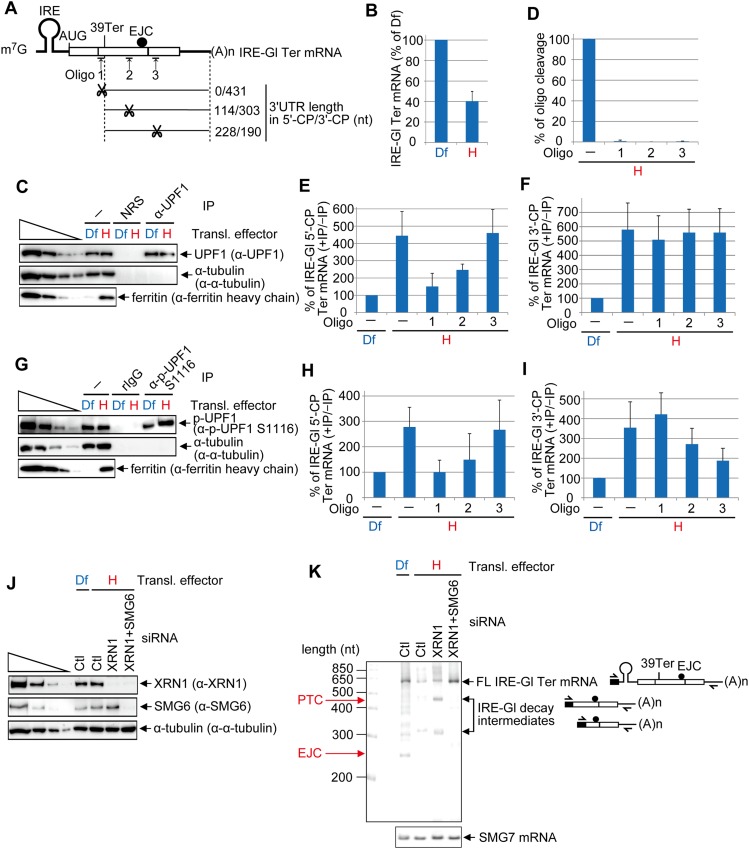
Figure 4.
DNA oligo-directed RNase H cleavage maps p-UPF1 binding to NMD target 3′ UTRs. (A) Diagrams of spliced IRE-Gl PTC-containing (39 Ter) mRNA. Upward-facing arrows indicate a site of DNA oligo-directed RNase H cleavage, and the ratio to the right of scissors specifies the number of 3′ UTR nucleotides in the 5′-CP/number of 3′ UTR nucleotides in the 3′-CP. (B) RT-qPCR of RNA from HeLa cells stably expressing IRE-Gl Ter mRNA (1 × 10⁷ per 150-mm dish) that were cultured in the presence of 100 μM Df or hemin (H) for 8 h. The level of IRE-Gl Ter mRNA was normalized to the level of cellular SMG7 mRNA, and the normalized level in the presence of Df is defined as 100%. (C) Western blotting of lysates of HeLa cells stably expressing IRE-Gl Ter mRNA that were cultured in the presence of Df or hemin for 8 h and subsequently analyzed before (−) or after immunoprecipitation (IP) using the specified antibody (α). (D) RT-qPCR of IRE-Gl Ter mRNA to quantitate the level of cleavage, where the level in the absence (−) of DNA oligo is defined as 100%. (E) RT-qPCR of the 5′-CP of IRE-Gl mRNA essentially as in B except that the RT primer and PCR primer pair were specific for the 5′-CP. (F) As in E, but the RT primer and PCR primer pair were specific for the 3′-CP. (G) As in C, but anti-p-UPF1(S1116) and, as a control, rIgG were used in the immunoprecipitations. (H) As in E. (I) As in F. Quantitations derive from four independently performed experiments and represent the mean plus standard deviations. (J) Western blotting of lysates of HeLa cells stably expressing IRE-Gl Ter mRNA (1 × 10⁷ per 150-mm dish) that were transiently transfected with 450 pmol of Ctl siRNA or XRN1 siRNA or 225 pmol of Ctl siRNA + 225 pmol of XRN1 siRNA and, 2 d later, cultured in the presence of Df or hemin for 8 h prior to lysis. (K) 5′-RACE of full-length (FL) and decay intermediates of IRE-Gl mRNA and RT–PCR of SMG7 mRNA in lysates from J, including diagrams of where each 5′-RACE primer anneals. Diagrams are as in A, with the black box specifying oligo dC generated using terminal deoxnucleotidyl transferase.

