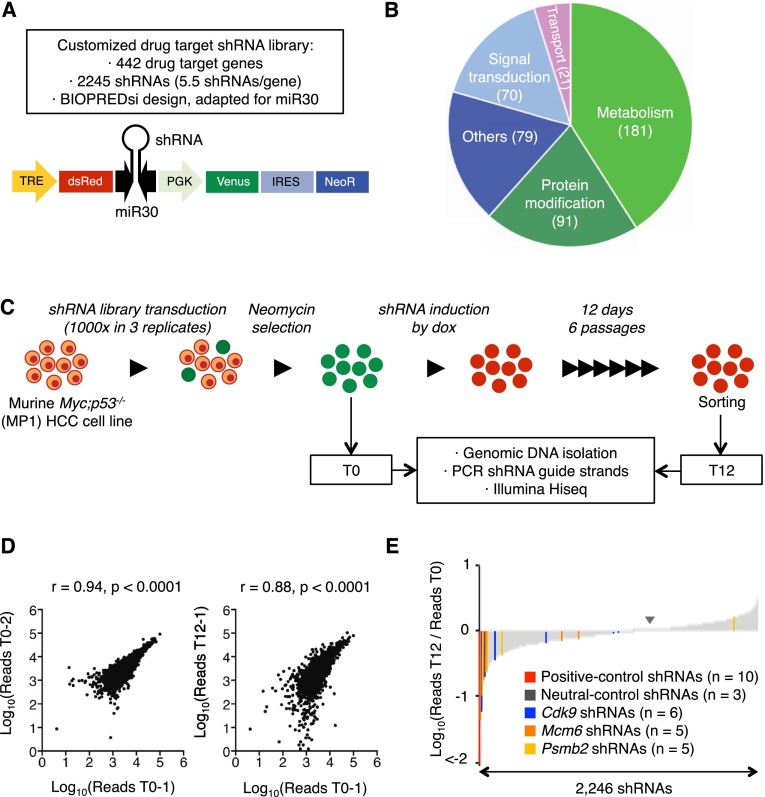
Figure 1.
RNAi screen for genes encoding known drug targets. (A) Library features and schematic of the TRMPV-neo vector. (B) Pathway categories of “drug target” genes included in the library. Numbers indicate the number of genes in each category. All shRNA sequences are provided in Supplemental Table 1. (C) RNAi screening strategy. (D) Representative scatter plots illustrating the correlation of normalized reads per shRNA between replicates at the beginning of the experiment (left) and replicates at different time points (right) (related to Supplemental Table 2). (E) Pooled negative selection screening results in MP1 (Myc;p53−/− clone 1 murine HCC cells) murine HCC cells. After eliminating underrepresented shRNAs at T0 (beginning of the experiment), shRNA abundance ratios of 2246 shRNAs were calculated as the number of normalized reads after 12 d of culture on dox (T12, end) divided by the number of normalized reads before dox treatment (T0) and are plotted as the mean of three replicates in ascending order.

