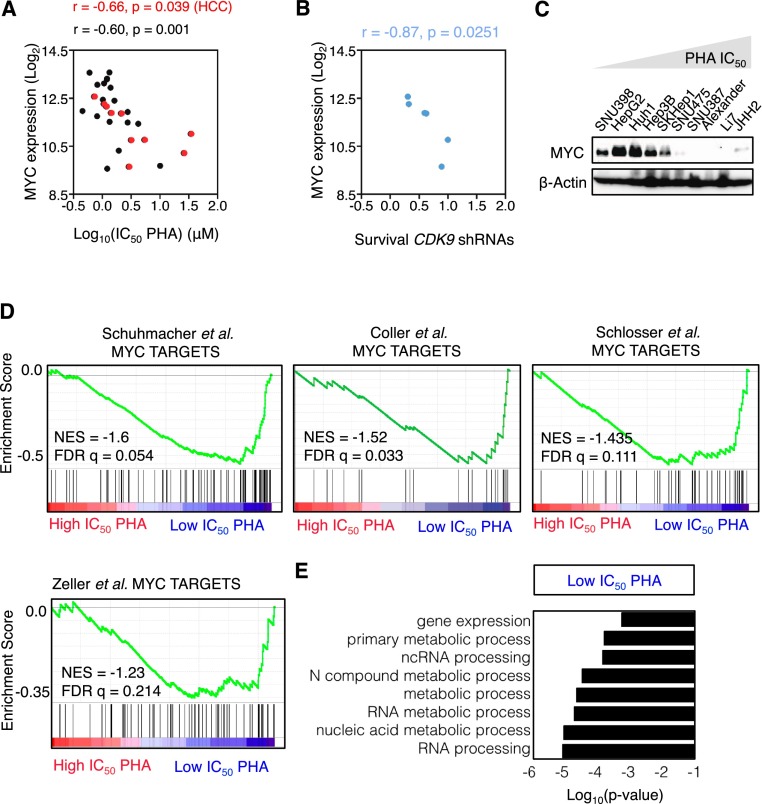
Figure 4.
MYC expression predicts response to CDK9 inhibition. (A) Scatter plot illustrating the correlation between PHA-767491 (PHA) IC50 values and MYC expression levels in human HCC (red; from Fig. 3B,C), leukemia, lymphoma, and lung cancer cell lines (n = 28). (B) Scatter plot illustrating the correlation between survival with CDK9 shRNAs and MYC expression levels in a panel of different human HCC cell lines (from Fig. 2F). The survival is defined as the average of the survival ratio of two shRNAs in competitive proliferation assay. (C) Immunoblots showing MYC protein levels in 10 human HCC cell lines. β-Actin was used as loading control. (D) GSEA plot evaluating the association between low IC50 of PHA-767491 and MYC targets. (NES) Normalized enrichment score; (FDR) false discovery rate. (E) GO term analysis of the genes that are significantly associated with sensitivity to PHA-767491.

