Figure 5.
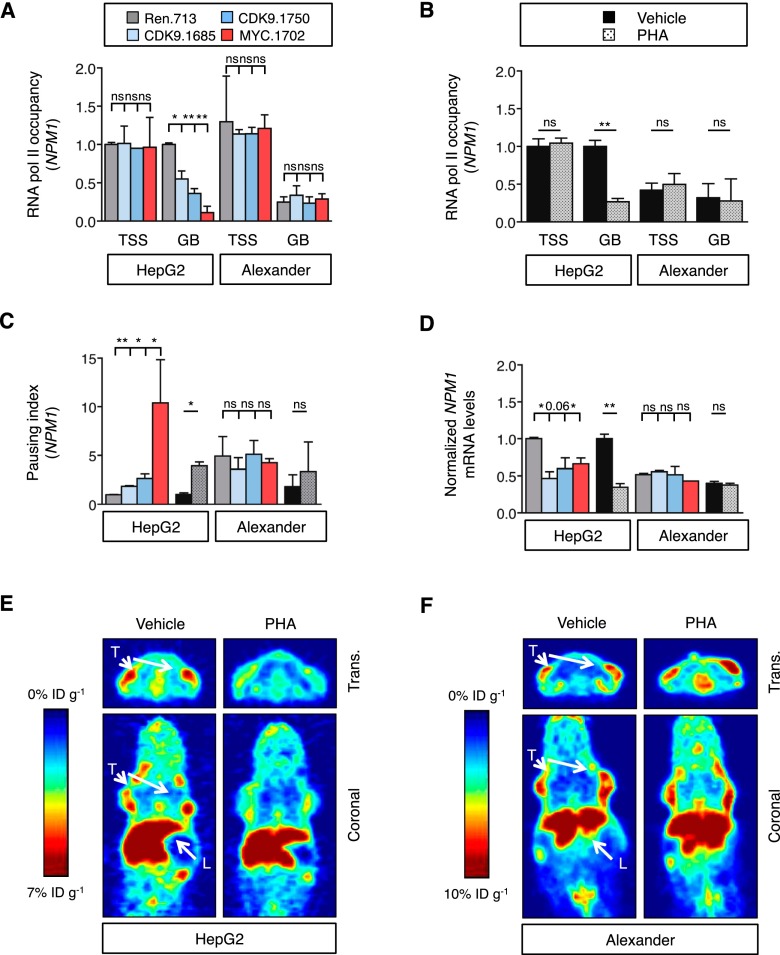
CDK9 mediates transcription elongation of MYC targets in MYC-overexpressing cancer cells. (A,B) Chromatin immunoprecipitation combined with quantitative PCR (ChIP-qPCR) performed in human HCC cells expressing CDK9 and MYC shRNAs (A) or treated with PHA-767491 (PHA; 6 h at 4.5 μM) (B), with RNA Pol II antibody and primers located in either the transcription start site (TSS) or the gene body (GB) of NPM1. RNA Pol II occupancy relative to control condition in HepG2 cells is shown. Values are mean + SD from two independent experiments. (C) Pausing index of NPM1 in human HCC cell lines. The pausing index, also known as traveling ratio, was calculated as the ratio between the RNA Pol II bound to the TSS and the RNA Pol II bound to the GB. Values are mean + SD from two independent experiments. Color code and statistics are as in A and B. (D) Quantitative RT–PCR of NPM1 in human HCC cell lines treated with PHA-767491 (16 h at 4.5 μM) or with CDK9 shRNAs. Data are relative to expression in the untreated cells or Renilla-shRNA in HepG2 cells, normalized to the average expression of the housekeeping gene GAPDH. Values are mean + SD from two independent experiments. Color code and statistics are as in A and B. (E,F) PET imaging with 89Zr-transferrin of HepG2 (E) or Alexander (F) tumors with or without 3-d treatment with PHA-767491. (L) Liver; (T) tumor; (trans.) transverse. The color scale for all PET image data shows radiotracer uptake in units of injected dose per gram (%ID/g), with red corresponding to the highest activity, and blue corresponding to the lowest activity.

