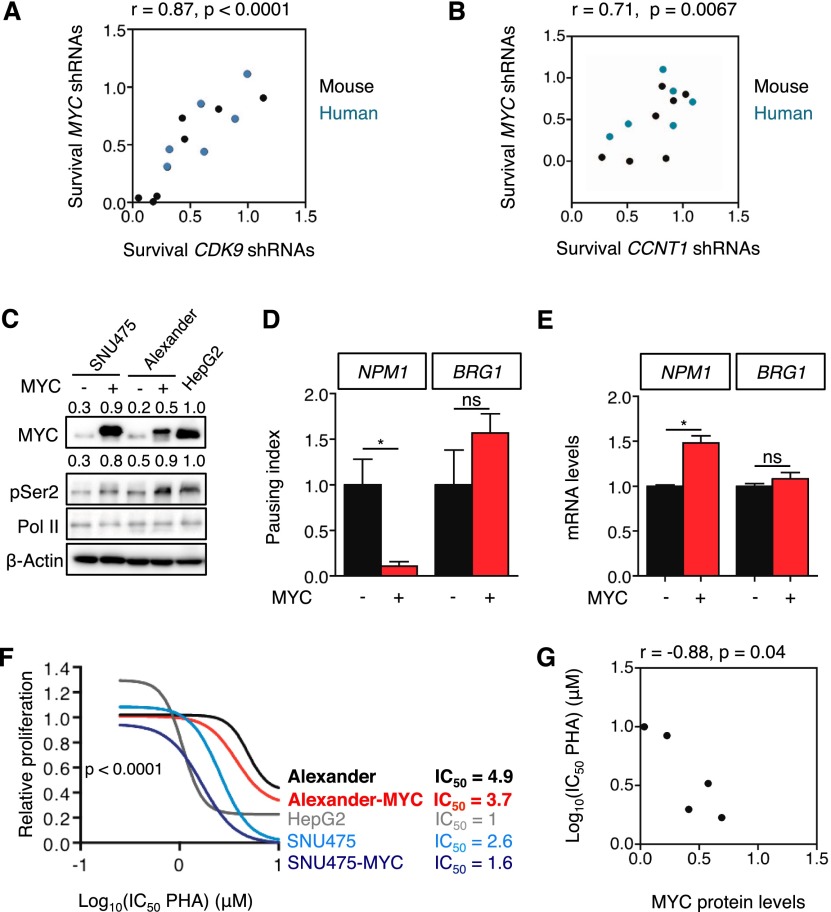
Figure 6.
Transcription elongation is required to maintain proliferation in MYC-overexpressing HCC. (A,B) Scatter plot illustrating the correlation between survival with MYC shRNAs and survival with CDK9 shRNAs (A) or CCNT1 shRNAs (B) in mouse (black) and human (blue) cell lines (from Fig. 2E,F). The survival is defined as the ratio of surviving cells in the competitive proliferation assays. In the case of CDK9 and CCNT1, the average of the survival of two different shRNAs was used. (C) Immunoblots showing the effect of MYC overexpression on Ser2 phosphorylation of RNA Pol II in low-MYC-expressing SNU475 and Alexander cells. β-Actin was used as loading control. Values indicate normalized protein levels, normalized with β-actin or RNA Pol II and relative to the levels in HepG2 cells. (D) Pausing index of NPM1 and BRG1 in Alexander cells overexpressing MYC. Pausing index, also known as traveling ratio, was calculated as the ratio between the RNA Pol II bound to the TSS and the RNA Pol II bound to the gene body. Values are mean + SD from two independent experiments. (E) Quantitative RT–PCR of NPM1 and BRG1 in Alexander cells overexpressing MYC. Data are relative to expression in the cells expressing an empty vector, normalized to the average expression of the housekeeping gene GAPDH. Values are mean + SD from two independent experiments. (F) Proliferation rates of PHA-767491 (PHA)-treated cells in C, calculated by measuring the increase in viable cell number after 72 h in culture and fitting data to an exponential growth curve. Results are normalized to the proliferation rate of vehicle (H2O)-treated cells, set to 1. Values are mean ± SD of two independent replicates. The IC50 values are included at the right in micromolar (μM). (G) Scatter plot illustrating the correlation between MYC protein levels and the IC50 of PHA-767491 on the different cell lines (related to C and F).

