Figure 7.
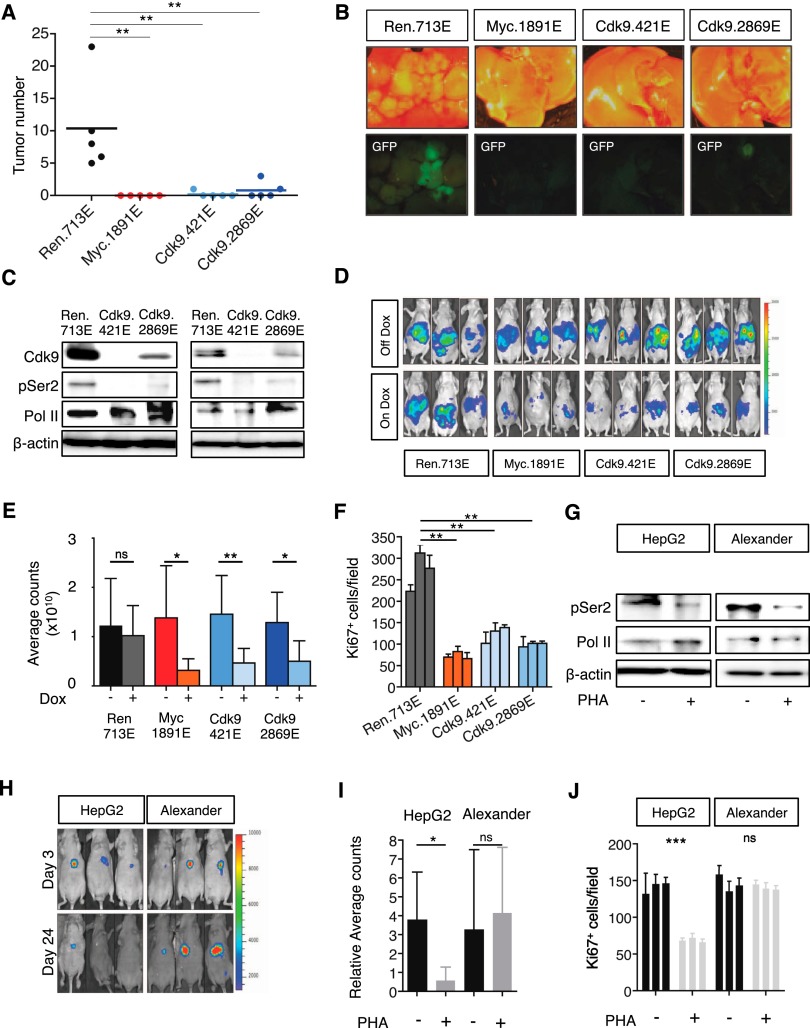
CDK9 is required for initiation and maintenance of MYC-overexpressing liver tumors. (A) Dot plot representation of the number of liver tumors after the hydrodynamic injection of Myc oncogene and the corresponding shRNAs. Bars represent the mean ± SD of five independent mice. (B) Representative bright-field and fluorescent images of the livers in A. Tumors are positive for GFP. (C) Immunoblots showing the knockdown induced by Cdk9 shRNAs in two representative tumors. Cdk9 inhibition leads to a decrease in the levels of phosphorylation of Ser2 of RNA Pol II (pSer2) and mild changes in total RNA Pol II levels (Pol II). β-Actin was used as loading control. (D) Bioluminescent imaging of representative mice orthotopically transplanted with MP1 (Myc;p53−/− murine HCC clone #1) cells harboring the indicated TRMPV-Neo-miR-E shRNAs 8 d after dox treatment. Dox was administered upon disease onset, 7 d after transplant. (E) Quantification of bioluminescent imaging responses with or without dox treatment. Values are mean + SD of six independent tumors. (F) Quantification of the number of Ki67-positive cells per field after analyzing three fields per animal and three animals per condition. Values are mean + SD. (G) Immunoblot showing the effects caused by PHA-767491 in two representative tumors. PHA-767491 treatment leads to a decrease in the levels of phosphorylation of Ser2 of RNA Pol II (pSer2) and mild changes in total RNA Pol II levels (Pol II). β-Actin was used as loading control. (H) Bioluminescent imaging of representative mice orthotopically transplanted with either HepG2 or Alexander HCC cells. PHA-767491 was administered upon disease onset (considered as day 0), 28 d after transplant. Days 3 and 24 of treatment are shown. (I) Quantification of bioluminescent imaging responses with or without PHA-767491 treatment. Values are mean + SD of seven or eight independent tumors. (J) Quantification of the number of Ki67-positive cells per field after analyzing three fields per animal and three animals per condition. Values are mean + SD.

