Figure 5.
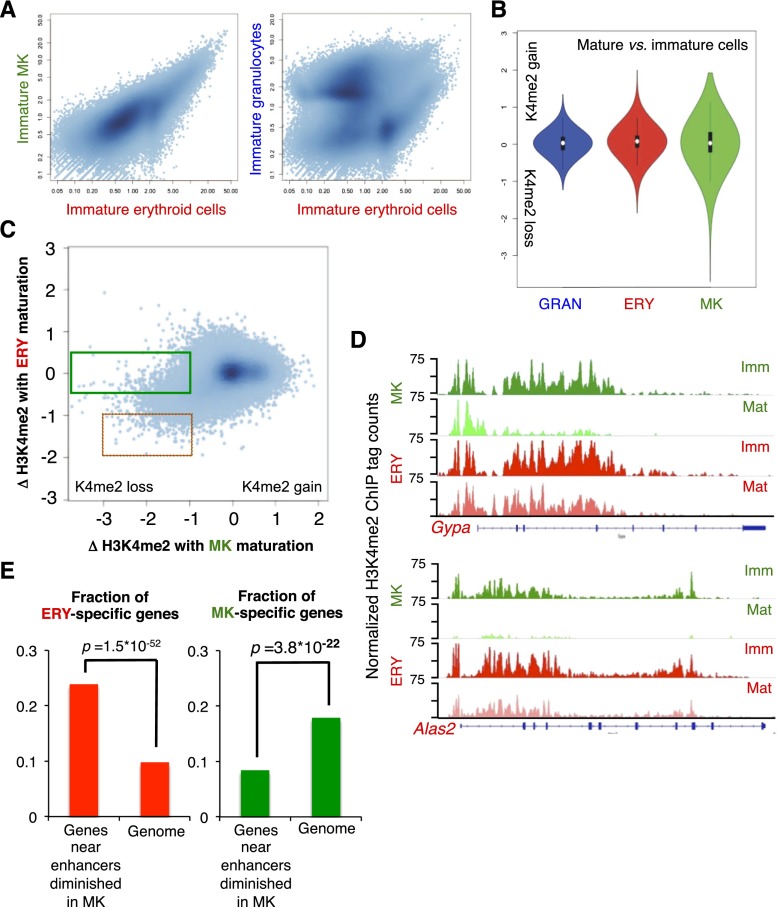
Functionally significant gains and losses of chromatin marks accompany terminal blood cell maturation. (A) Scatter plots representing the relationship of all H3K4me2-marked enhancers in immature erythroid cells (X-axis) to those in immature MKs (left) and granulocytes (right). (B) Distribution of scores for the change in H3K4me2 levels at all MACS-identified enhancer peaks during maturation in three specified lineages. Positive values represent a gain, and negative values represent loss, of H3K4me2 signal, as explained in the Materials and Methods. (C) Scatter plot representing the dynamic change in H3K4me2 scores at each enhancer upon MK maturation (X-axis) compared with changes at the same site during erythroid cell maturation (Y-axis). The dotted box demarcates regions that lose H3K4me2 during maturation of both lineages, and the green box demarcates the 5000 regions most significantly affected in mature MKs, with minimal change (values near 0) in mature erythroid cells. (D) H3K4me2 distributions at representative erythroid (ERY)-specific loci Gypa and Alas2, showing significant signal loss during MK maturation. (E) Graphs showing the fractions of erythroid- and MK-expressed genes among those located <20 kb from H3K4me2 peaks demarcated by the green box in C.

