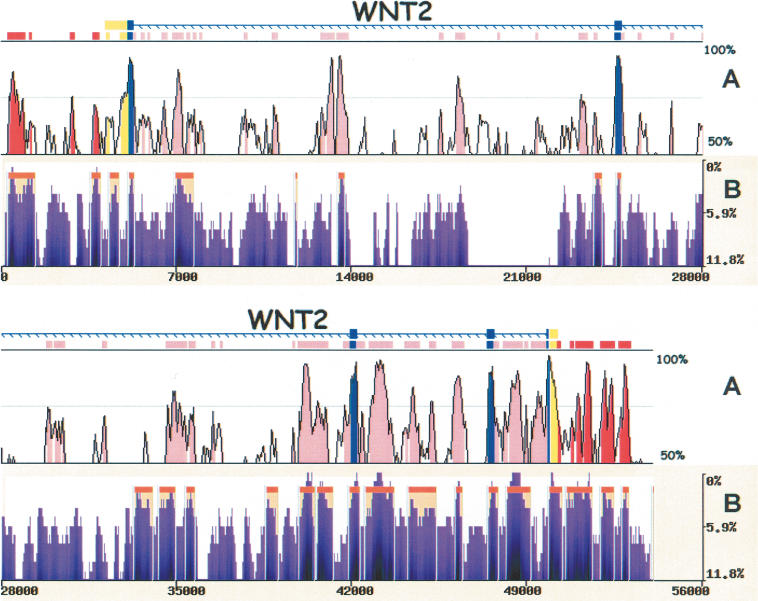
Figure 4.
eShadow analysis for the WNT2 region. Human/mouse conservation plot (A) compared with human/baboon/chimp eShadow conservation plot (B). Human/mouse alignments were generated and visualized by the zPicture program (http://zpicture.dcode.org), using standard parameters (≥ 100 bp; ≥ 70%) and conserved elements corresponding to exons (blue), UTRs (yellow), intronic (pink), and intergenic (red) elements are indicated (A). Human/baboon/chimp alignment plot (B) depicting regions of conservation (purple) and HMMI predictions (beige). y-axis corresponds to percent identity (A) and percent variation (B). x-axis corresponds to size in base pairs (A,B).

