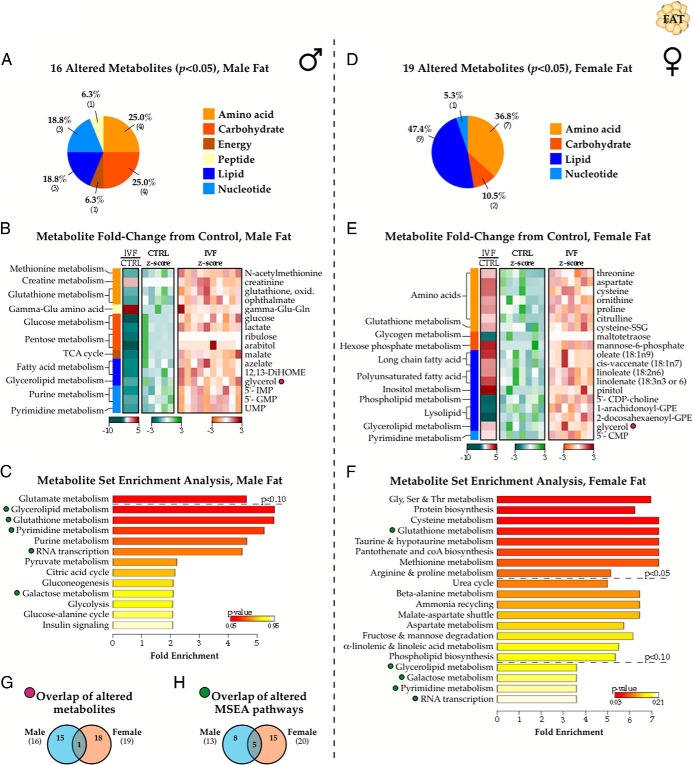
Figure 2.
Effect of IVF on the adult fat metabolome. A, Categorical distribution of the 16 metabolites significantly altered in IVF males from controls. B, Heat map depicting fold-change in metabolite concentration between IVF and control metabolite values in male fat samples, including z-distribution of individual control (blue) and IVF (red) values relative to their respective population means. C, MSEA summary of Bonferroni-corrected pathways associated with the metabolite changes. D–F, Same as A–C but for the 19 metabolites altered in female IVF fat samples. G and H, Venn diagrams showing overlap in altered metabolites (G and purple symbols) and MSEA-identified pathways (H and green symbols) between male and female IVF cohorts. CDP, cytidine diphospho; CMP, cytidine monophosphate; Glu-Gln, glutamylglutamine; IMP, inosine monophosphate; SSG, glutathione disulfide; UMP, uridine monophosphate.

