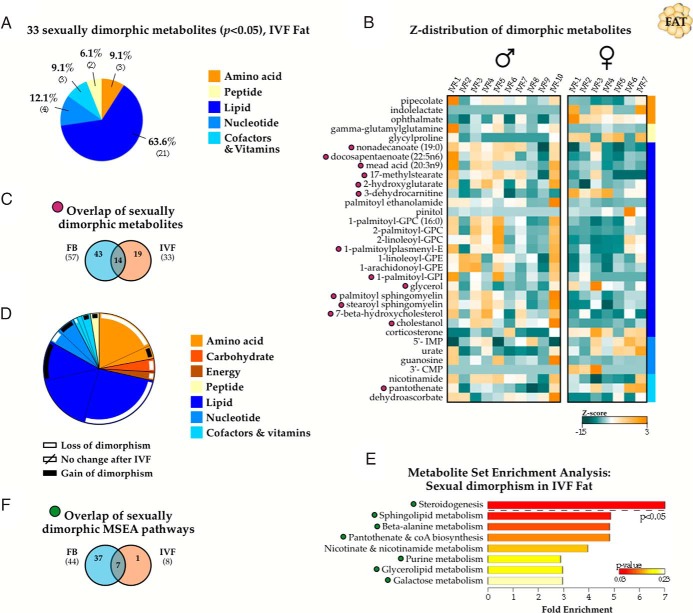
Figure 3.
Reduced sexual dimorphism in IVF fat tissue. A, A total of 33 metabolites (14.3%) were sexually dimorphic (P < .05 between males and females) in fat samples from IVF animals (n = 10 males and 7 females). B, Z-score normalized expression of the IVF-associated sexually dimorphic metabolites, with purple symbols indicating metabolites retaining male vs female differences in both IVF and control samples. C, MSEA categorization showing a significantly decreased number of dimorphic pathways, with green symbols marking pathways with retained dimorphism from controls. D and F, Overlap of sexually dimorphic metabolites (D and purple symbols) and MSEA-identified pathways (F and green symbols) comparing control and IVF cohorts. E, Categorical distribution of the metabolites displaying altered sexual dimorphism. The white bars indicate metabolites with lost male vs female significance in IVF, and black bars show the percentage of metabolites acquiring significant male vs female concentrations in IVF compared with controls. For example, of the 41 lipid-categorized metabolites displaying male-female differences in at least 1 conception condition (dark blue section), 21 are no longer dimorphic in IVF tissues (black bar), 12 maintain sexual dimorphism in both control and IVF groups, and 8 exhibit dimorphism only in IVF samples (white bar). CMP, cytidine monophosphate; E, ethanolamine; GPC, glycerophosphocholine; GPI, glycerophosphoinositol; IMP, inosine monophosphate.

