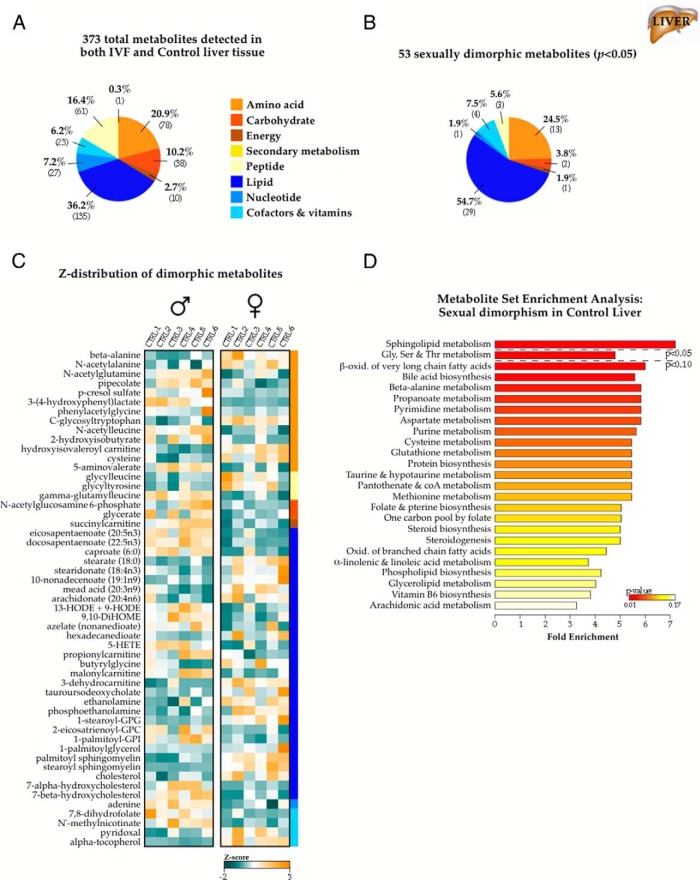
Figure 4.
Metabolic sexual dimorphism in adult liver tissue. A, Nontargeted mass spectrometry profiling of 29-week IVF and control livers (n = 6 per sex and conception condition; 24 animals total) identified 373 named biochemicals comprising all major metabolic groups. B, Categorical distribution of the 53 metabolites with significantly different concentrations between males and females in control samples (P < .05). C, Z-distribution of the sexually dimorphic metabolites in control samples. Of note, concentrations of metabolites were not uniformly changed in one sex vs the other, as observed in fat tissue. Instead, there are more segmented and pathway-specific changes. D, MSEA summary with pathways ranked by Bonferroni-corrected P value. GPC, glycerophosphocholine; GPG, glycerophosphoglycerol; GPI, glycerophosphoinositol.

