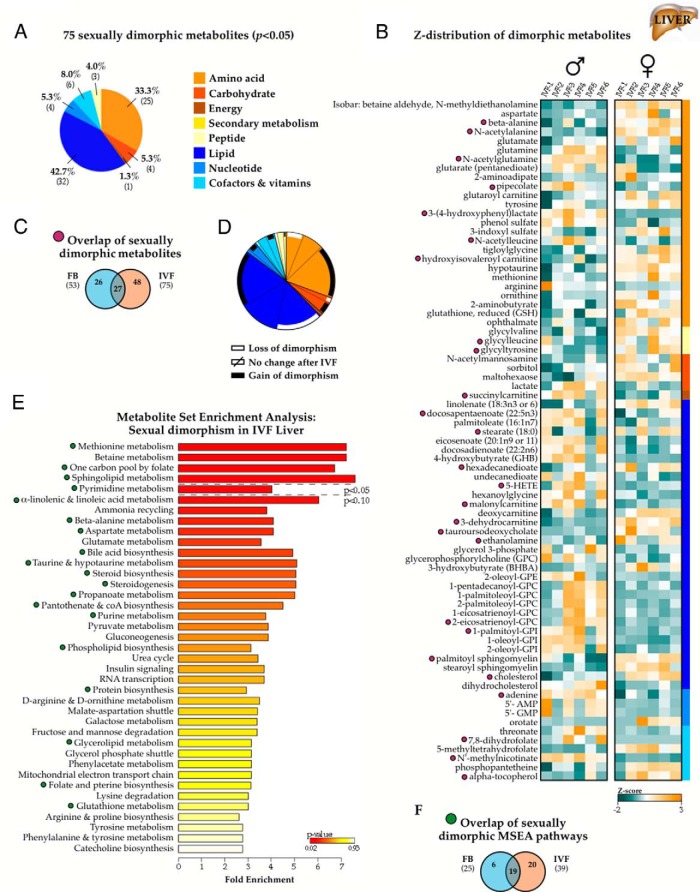
Figure 6.
Exaggerated sexual dimorphism in IVF liver tissue. A, A total of 75 metabolites (20.1%) exhibited sexually dimorphic concentrations (P < .05 between males and females) in liver samples from IVF animals (n = 6 males and 6 females). B, Z-score normalized expression of the IVF-associated sexually dimorphic metabolites, with purple symbols indicating metabolites retaining male vs female differences in both IVF and control samples. C, Categorization of enriched pathways in the metabolite set, with green symbols marking pathways with retained dimorphism from controls. D and F, Overlap of sexually dimorphic metabolites (D and purple symbols) and MSEA-identified pathways (F and green symbols) comparing control and IVF liver cohorts. E, Categorical distribution of the metabolites displaying altered sexual dimorphism, with white and black bars indicating metabolites with lost or acquired significant male-female differences, respectively, in IVF vs control livers, as discussed in Figure 3E. GPC, glycerophosphocholine; GPI, glycerophosphoinositol.

