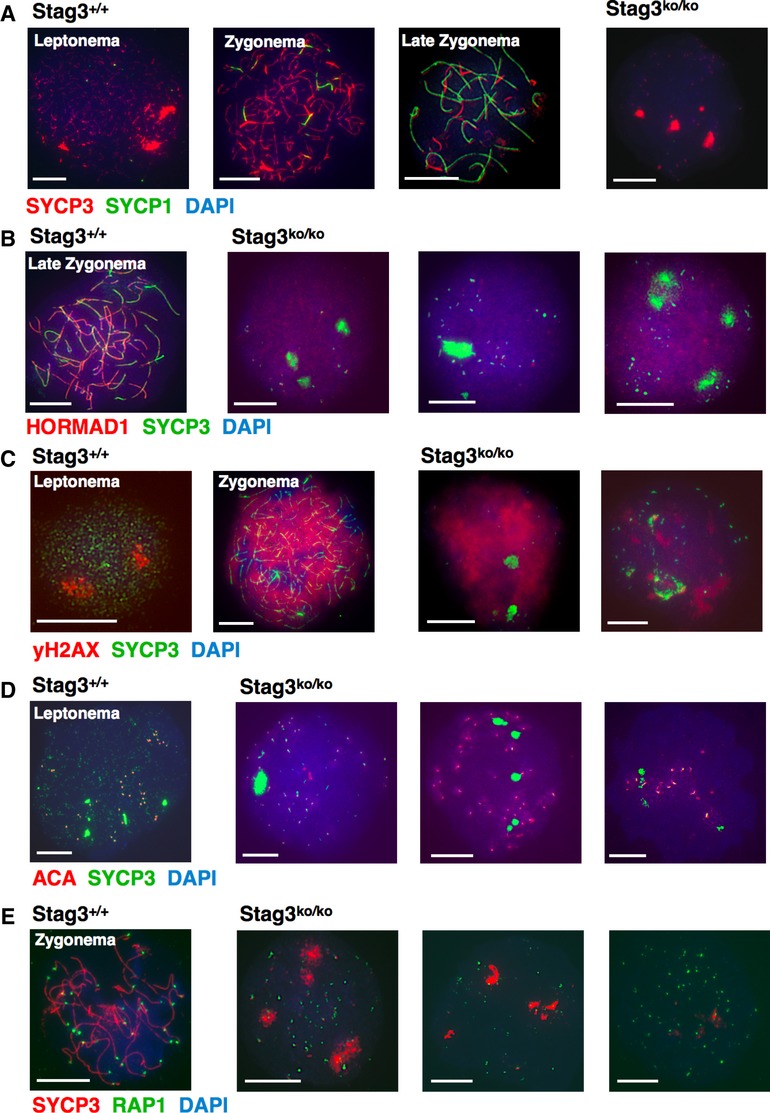
Figure 7. Analysis of embryonic day 15 oocyte chromosomes of wt and Stag3ko/ko mice.

A–E Immunofluorescence staining of chromosome spreads with anti-SYCP3 and (A) SYCP1 as a synapsis marker; (B) HORMAD1 as a marker for unsynapsed regions; (C) γH2AX to show progression through the initial stages of prophase I; (D) anti-centromere antibody ACA; (E) anti-RAP1 to visualize telomeres. Size bars indicate 10 μm.
