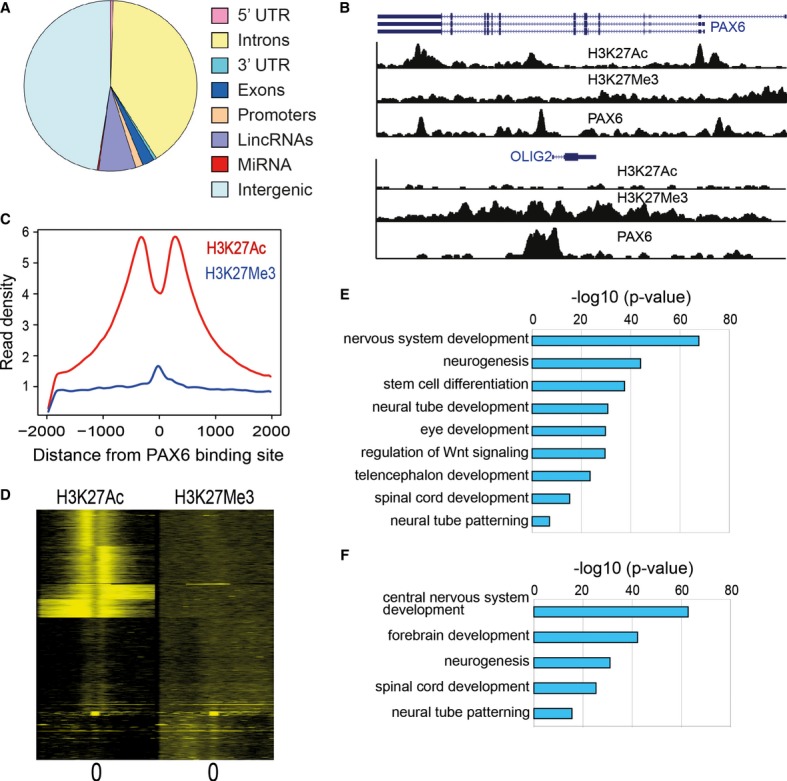
Distribution of PAX6 binding sites in different genomic regions. Promoters were defined as ±2 kb from the transcriptional start site (TSS). For miRNAs, we mapped binding sites to within 20 kb from the mature sequence. Intergenic regions were defined as non-genic regions that did not map to any promoters or gene bodies or non-coding RNAs.
Genome browser snapshot of PAX6 binding sites overlapping with H3K27Ac and H3K27Me3 signal proximal to PAX6 and OLIG2 TSS.
Average distribution of H3K27Ac and H3K27Me3 signal relative to the center of PAX6 binding sites. On the x-axis, 0 indicates the PAX6 peak center as identified from ChIP-Seq data. Read densities were normalized for sequencing depth.
Heatmap of H3K27Ac and H3K27Me3 signals relative to the center of PAX6 binding sites. A window of 4,000 bp centered on the PAX6 peaks and binned into 50 bp bins has been displayed. Individual profiles were clustered by k-means clustering.
Enriched functional categories derived by GREAT analysis for all PAX6 targets (threshold P-value = 1e−10).
Enriched functional categories derived by GREAT analysis for PAX6 transcriptional targets (threshold P-value = 1e−10).