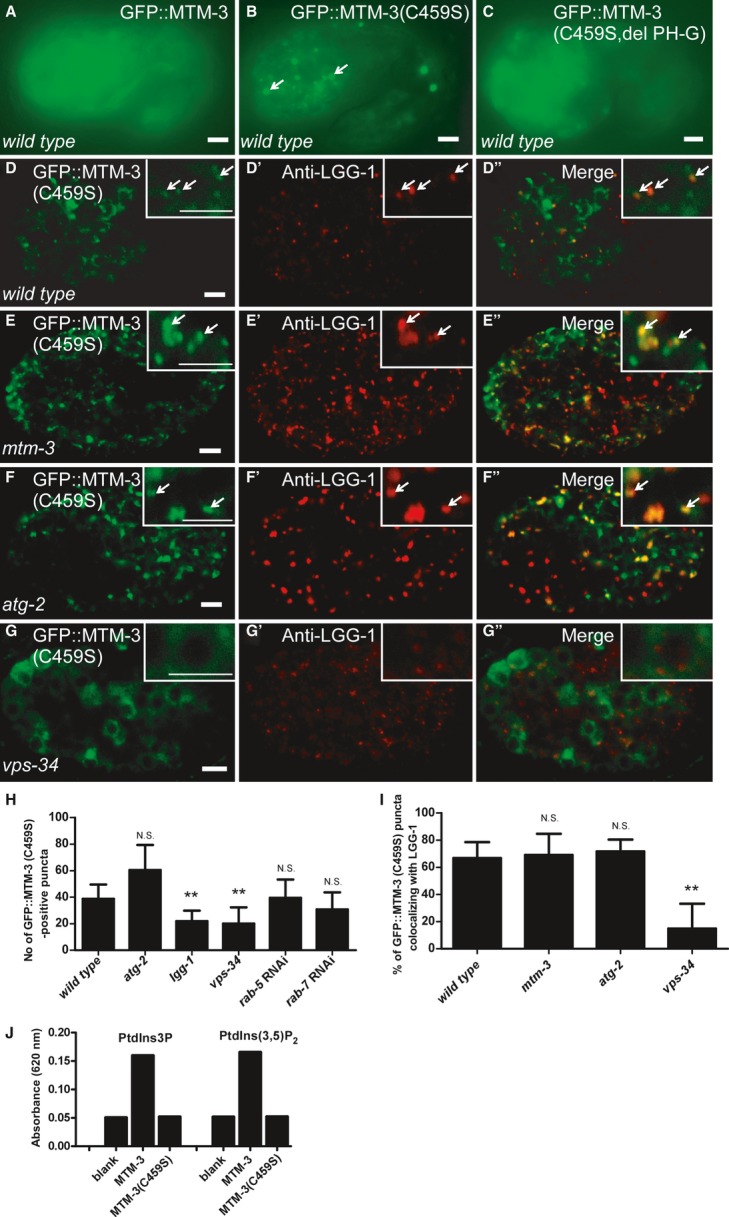
Figure 2. GFP::MTM-3(C459S) associates with autophagic structures.

A–C Fluorescent images of wild-type embryos (1.5-fold stage) expressing GFP::MTM-3 (A), GFP::MTM-3(C459S) (B), or GFP::MTM-3(C459S, del PH-G) (C).
D-G″ Confocal fluorescent images of wild-type (D-D″), mtm-3 (E-E″), atg-2 (F-F″), and vps-34 (G-G″) embryos at the 200-cell stage expressing GFP::MTM-3(C459S) and stained by anti-LGG-1 antibody. Insets show magnified views. Arrows indicate overlapping GFP and LGG-1 puncta. Scale bars: 5 μm.
H, I Number of GFP::MTM-3(C459S)-positive puncta and co-localization of GFP::MTM-3(C459S)- and LGG-1-positive puncta in various strains [mtm-3(tm4475), atg-2(bp576), lgg-1(bp500), vps-34(h797)]. At least 10 (I) and 15 (H) embryos were scored per strain. Data are shown as mean ± SD. Data from different mutant backgrounds were compared with wild type. **P < 0.0001; N.S.: not statistically different.
J MTM-3 but not MTM-3(C459S) exhibits phosphatase activity toward PtdIns3P and PtdIns(3,5)P2 in vitro.
Source data are available online for this figure.
