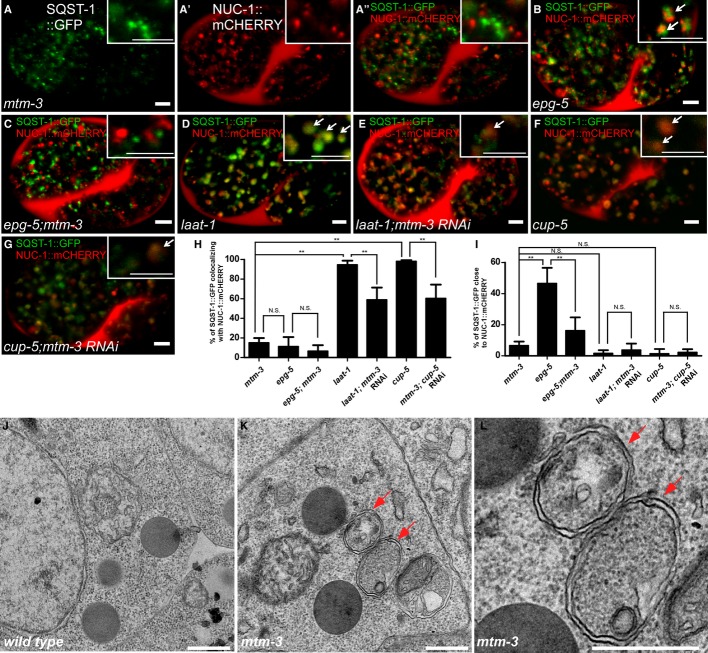
Figure 4. Loss of mtm-3 impairs autolysosome formation.
A–G Confocal fluorescent images of 1.5-fold-stage embryos from the indicated strains expressing both SQST-1::GFP and NUC-1::mCHERRY. Insets show magnified views. Arrows indicate overlapping or closely associated GFP and mCHERRY. Scale bars: 5 μm. The wild type contains no visible SQST-1::GFP puncta at this stage and is therefore not shown.
H, I The percentage of SQST-1::GFP-positive puncta that overlap with (H) or are close to (I) NUC-1::mCHERRY-positive structures in each strain. At least 10 embryos were scored per strain. Data are shown as mean ± SD. **P < 0.0001; N.S.: not statistically different.
J–L TEM analysis of embryos in wild type (I) and mtm-3(tm4475) (J, K). Double-membrane autophagosomes (arrows) were observed in mtm-3 but not wild-type embryos. Scale bars: 500 nm.
Source data are available online for this figure.

